<cfscript>
// ChartDirector for ColdFusion API Access Point
cd = CreateObject("java", "ChartDirector.CFChart");
// A utility to allow us to create arrays with data in one line of code
function Array() {
var result = ArrayNew(1);
var i = 0;
for (i = 1; i LTE ArrayLen(arguments); i = i + 1)
result[i] = arguments[i];
return result;
}
//
// Initialize the WebChartViewer when the page is first loaded
//
function initViewer(viewer)
{
//
// This example assumes the initial chart is the full chart and we can auto-detect the full data
// range in the drawChart code. So we do not need to configure the full range here.
//
}
//
// Draw the main chart
//
function drawChart(viewer)
{
// Declare local variables
var dataX0 = 0;
var dataY0 = 0;
var dataX1 = 0;
var dataY1 = 0;
var dataX2 = 0;
var dataY2 = 0;
var c = 0;
var legendBox = 0;
var chartQuery = 0;
var imageMap = 0;
//
// For simplicity, in this demo, the data arrays are filled with hard coded data. In a real
// application, you may use a database or other data source to load up the arrays, and only
// visible data (data within the view port) need to be loaded.
//
dataX0 = Array(10, 15, 6, -12, 14, -8, 13, -3, 16, 12, 10.5, -7, 3, -10, -5, 2, 5);
dataY0 = Array(130, 150, 80, 110, -110, -105, -130, -15, -170, 125, 125, 60, 25, 150, 150, 15,
120);
dataX1 = Array(6, 7, -4, 3.5, 7, 8, -9, -10, -12, 11, 8, -3, -2, 8, 4, -15, 15);
dataY1 = Array(65, -40, -40, 45, -70, -80, 80, 10, -100, 105, 60, 50, 20, 170, -25, 50, 75);
dataX2 = Array(-10, -12, 11, 8, 6, 12, -4, 3.5, 7, 8, -9, 3, -13, 16, -7.5, -10, -15);
dataY2 = Array(65, -80, -40, 45, -70, -80, 80, 90, -100, 105, 60, -75, -150, -40, 120, -50, -30)
;
// Create an XYChart object 500 x 480 pixels in size, with light blue (c0c0ff) background
c = cd.XYChart(500, 480, "0xc0c0ff");
// Set the plotarea at (50, 40) and of size 400 x 400 pixels. Use light grey (c0c0c0) horizontal
// and vertical grid lines. Set 4 quadrant coloring, where the colors alternate between lighter
// and deeper grey (dddddd/eeeeee).
c.setPlotArea(50, 40, 400, 400, -1, -1, -1, "0xc0c0c0", "0xc0c0c0").set4QBgColor("0xdddddd",
"0xeeeeee", "0xdddddd", "0xeeeeee", "0x000000");
// As the data can lie outside the plotarea in a zoomed chart, we need enable clipping
c.setClipping();
// Set 4 quadrant mode, with both x and y axes symetrical around the origin
c.setAxisAtOrigin(cd.XYAxisAtOrigin, cd.XAxisSymmetric + cd.YAxisSymmetric);
// Add a legend box at (450, 40) (top right corner of the chart) with vertical layout and 8pt
// Arial Bold font. Set the background color to semi-transparent grey (40dddddd).
legendBox = c.addLegend(450, 40, True, "Arial Bold", 8);
legendBox.setAlignment(cd.TopRight);
legendBox.setBackground("0x40dddddd");
// Add titles to axes
c.xAxis().setTitle("Alpha Index");
c.yAxis().setTitle("Beta Index");
// Set axes line width to 2 pixels
c.xAxis().setWidth(2);
c.yAxis().setWidth(2);
// The default ChartDirector settings has a denser y-axis grid spacing and less-dense x-axis
// grid spacing. In this demo, we want the tick spacing to be symmetrical. We use around 40
// pixels between major ticks and 20 pixels between minor ticks.
c.xAxis().setTickDensity(40, 20);
c.yAxis().setTickDensity(40, 20);
//
// In this example, we represent the data by scatter points. You may modify the code below to
// use other layer types (lines, areas, etc).
//
// Add scatter layer, using 11 pixels red (ff33333) X shape symbols
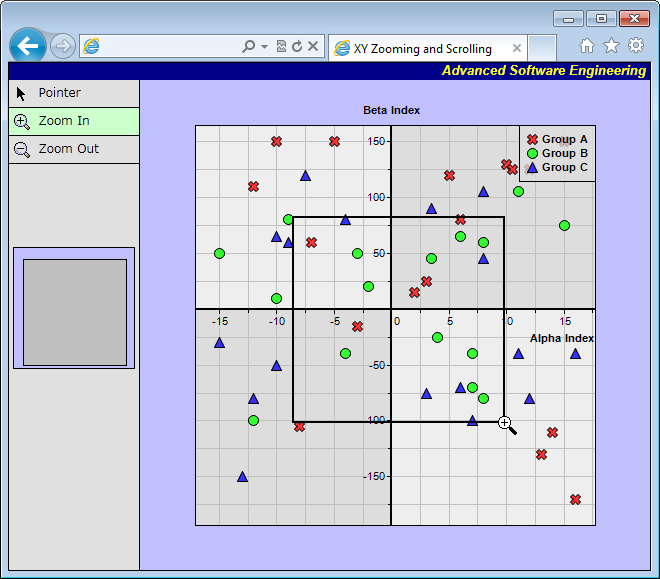
c.addScatterLayer(dataX0, dataY0, "Group A", cd.Cross2Shape(), 11, "0xff3333");
// Add scatter layer, using 11 pixels green (33ff33) circle symbols
c.addScatterLayer(dataX1, dataY1, "Group B", cd.CircleShape, 11, "0x33ff33");
// Add scatter layer, using 11 pixels blue (3333ff) triangle symbols
c.addScatterLayer(dataX2, dataY2, "Group C", cd.TriangleSymbol, 11, "0x3333ff");
//
// In this example, we have not explicitly configured the full x and y range. In this case, the
// first time syncLinearAxisWithViewPort is called, ChartDirector will auto-scale the axis and
// assume the resulting range is the full range. In subsequent calls, ChartDirector will set the
// axis range based on the view port and the full range.
//
viewer.syncLinearAxisWithViewPort("x", c.xAxis());
viewer.syncLinearAxisWithViewPort("y", c.yAxis());
// Output the chart
chartQuery = c.makeSession(GetPageContext(), viewer.getId());
// Include tool tip for the chart
imageMap = c.getHTMLImageMap("", "", "title='[{dataSetName}] Alpha = {x|G}, Beta = {value|G}'");
// Set the chart URL, image map and chart metrics to the viewer
viewer.setImageUrl("getchart.cfm?" & chartQuery);
viewer.setImageMap(imageMap);
viewer.setChartMetrics(c.getChartMetrics());
}
//
// Draw the thumbnail chart in the WebViewPortControl
//
function drawFullChart(vp, viewer)
{
// Declare local variables
var dataX0 = 0;
var dataY0 = 0;
var dataX1 = 0;
var dataY1 = 0;
var dataX2 = 0;
var dataY2 = 0;
var c = 0;
var chartQuery = 0;
//
// For simplicity, in this demo, the data arrays are filled with hard coded data. In a real
// application, you may use a database or other data source to load up the arrays. As this is a
// small thumbnail chart, complete data may not be needed. For exmaple, if there are a million
// points, a random sample may already be sufficient for the thumbnail chart.
//
dataX0 = Array(10, 15, 6, -12, 14, -8, 13, -3, 16, 12, 10.5, -7, 3, -10, -5, 2, 5);
dataY0 = Array(130, 150, 80, 110, -110, -105, -130, -15, -170, 125, 125, 60, 25, 150, 150, 15,
120);
dataX1 = Array(6, 7, -4, 3.5, 7, 8, -9, -10, -12, 11, 8, -3, -2, 8, 4, -15, 15);
dataY1 = Array(65, -40, -40, 45, -70, -80, 80, 10, -100, 105, 60, 50, 20, 170, -25, 50, 75);
dataX2 = Array(-10, -12, 11, 8, 6, 12, -4, 3.5, 7, 8, -9, 3, -13, 16, -7.5, -10, -15);
dataY2 = Array(65, -80, -40, 45, -70, -80, 80, 90, -100, 105, 60, -75, -150, -40, 120, -50, -30)
;
// Create an XYChart object 120 x 120 pixels in size
c = cd.XYChart(120, 120);
// Set the plotarea to cover the entire chart and with no grid lines. Set 4 quadrant coloring,
// where the colors alternate between lighter and deeper grey (d8d8d8/eeeeee).
c.setPlotArea(0, 0, c.getWidth() - 1, c.getHeight() - 1, -1, -1, -1, cd.Transparent
).set4QBgColor("0xd8d8d8", "0xeeeeee", "0xd8d8d8", "0xeeeeee", "0x000000");
// Set 4 quadrant mode, with both x and y axes symetrical around the origin
c.setAxisAtOrigin(cd.XYAxisAtOrigin, cd.XAxisSymmetric + cd.YAxisSymmetric);
// The x and y axis scales reflect the full range of the view port
c.xAxis().setLinearScale(viewer.getValueAtViewPort("x", 0), viewer.getValueAtViewPort("x", 1),
cd.NoValue);
c.yAxis().setLinearScale(viewer.getValueAtViewPort("y", 0), viewer.getValueAtViewPort("y", 1),
cd.NoValue);
// Add scatter layer, using 5 pixels red (ff33333) X shape symbols
c.addScatterLayer(dataX0, dataY0, "Group A", cd.Cross2Shape(), 5, "0xff3333");
// Add scatter layer, using 5 pixels green (33ff33) circle symbols
c.addScatterLayer(dataX1, dataY1, "Group B", cd.CircleShape, 5, "0x33ff33");
// Add scatter layer, using 5 pixels blue (3333ff) triangle symbols
c.addScatterLayer(dataX2, dataY2, "Group C", cd.TriangleSymbol, 5, "0x3333ff");
// Output the chart
chartQuery = c.makeSession(GetPageContext(), vp.getId());
// Set the chart URL and chart metrics to the viewport control
vp.setImageUrl("getchart.cfm?" & chartQuery);
vp.setChartMetrics(c.getChartMetrics());
}
//
// This script handles both the full page request, as well as the subsequent partial updates (AJAX
// chart updates). We need to determine the type of request first before we processing it.
//
// Create the WebChartViewer object
viewer = cd.WebChartViewer(GetPageContext(), "chart1");
if (viewer.isPartialUpdateRequest()) {
// Is a partial update request. Draw the chart and perform a partial response.
drawChart(viewer);
viewer.partialUpdateChart(GetPageContext());
return;
}
//
// If the code reaches here, it is a full page request.
//
// Initialize the WebChartViewer and draw the chart.
initViewer(viewer);
drawChart(viewer);
// Draw a thumbnail chart representing the full range in the WebViewPortControl
viewPortCtrl = cd.WebViewPortControl("fullchart1");
drawFullChart(viewPortCtrl, viewer);
</cfscript>
<!DOCTYPE html>
<html>
<cfoutput>
<head>
<title>XY Zooming and Scrolling</title>
<script type="text/javascript" src="cdjcv.js"></script>
<style type="text/css">
.chartButton { font:12px Verdana; border-bottom:##000000 1px solid; padding:5px; cursor:pointer;}
.chartButtonSpacer { font:12px Verdana; border-bottom:##000000 1px solid; padding:5px;}
.chartButton:hover { box-shadow:inset 0px 0px 0px 2px ##444488; }
.chartButtonPressed { background-color: ##CCFFCC; }
</style>
</head>
<body style="margin:0px">
<script type="text/javascript">
//
// Execute the following initialization code after the web page is loaded
//
JsChartViewer.addEventListener(window, 'load', function() {
// Update the chart when the view port has changed (eg. when the user zooms in using the mouse)
var viewer = JsChartViewer.get('#viewer.getId()#');
viewer.attachHandler("ViewPortChanged", viewer.partialUpdate);
// Set the zoom and scroll mode to bi-directional
viewer.setScrollDirection(JsChartViewer.HorizontalVertical);
viewer.setZoomDirection(JsChartViewer.HorizontalVertical);
// Set the initial mouse usage to "zoom in"
setMouseMode(JsChartViewer.ZoomIn);
// Initialize the view port control
var viewPortCtrl = JsViewPortControl.get('#viewPortCtrl.getId()#');
// Set the mask color to semi-transparent black
viewPortCtrl.setViewPortExternalColor("##80000000");
// Set the selection rectangle border to white
viewPortCtrl.setSelectionBorderStyle("1px solid white");
// Bind the view port control to the chart viewer
viewPortCtrl.setViewer(viewer);
});
//
// This method is called when the user clicks on the Pointer, Zoom In or Zoom Out buttons
//
function setMouseMode(mode)
{
var viewer = JsChartViewer.get('#viewer.getId()#');
if (mode == viewer.getMouseUsage())
mode = JsChartViewer.Default;
// Set the button color based on the selected mouse mode
document.getElementById("scrollButton").className = "chartButton" +
((mode == JsChartViewer.Scroll) ? " chartButtonPressed" : "");
document.getElementById("zoomInButton").className = "chartButton" +
((mode == JsChartViewer.ZoomIn) ? " chartButtonPressed" : "");
document.getElementById("zoomOutButton").className = "chartButton" +
((mode == JsChartViewer.ZoomOut) ? " chartButtonPressed" : "");
// Set the mouse mode
viewer.setMouseUsage(mode);
}
</script>
<form method="post">
<table cellspacing="0" cellpadding="0" style="border:black 1px solid;">
<tr>
<td align="right" colspan="2" style="background:##000088; color:##ffff00; padding:0px 4px 2px 0px;">
<a style="color:##FFFF00; font:italic bold 10pt Arial; text-decoration:none" href="http://www.advsofteng.com/">
Advanced Software Engineering
</a>
</td>
</tr>
<tr valign="top">
<td style="width:130px; background:##e0e0e0;">
<!-- The following table is to create 3 cells for 3 buttons to control the mouse usage mode. -->
<table cellspacing="0" cellpadding="0" width="100%" border="0">
<tr>
<td class="chartButton" id="scrollButton" onclick="setMouseMode(JsChartViewer.Scroll)"
ontouchstart="this.onclick(event); event.preventDefault();">
<img src="scrollnesw.gif" style="vertical-align:middle" alt="Drag" /> Drag to Scroll
</td>
</tr>
<tr>
<td class="chartButton" id="zoomInButton" onclick="setMouseMode(JsChartViewer.ZoomIn)"
ontouchstart="this.onclick(event); event.preventDefault();">
<img src="zoomInIcon.gif" style="vertical-align:middle" alt="Zoom In" /> Zoom In
</td>
</tr>
<tr>
<td class="chartButton" id="zoomOutButton" onclick="setMouseMode(JsChartViewer.ZoomOut)"
ontouchstart="this.onclick(event); event.preventDefault();">
<img src="zoomOutIcon.gif" style="vertical-align:middle" alt="Zoom Out" /> Zoom Out
</td>
</tr>
</table>
<br /><br /><br /><br /><br />
<div style="text-align:center;">
<!-- ****** Here is the view port control ****** -->
#viewPortCtrl.renderHTML(GetPageContext())#
</div>
</td>
<td style="border-left: black 1px solid; background-color: ##c0c0ff; padding:5px">
<!-- ****** Here is the chart image ****** -->
#viewer.renderHTML(GetPageContext())#
</td>
</tr>
</table>
</form>
</body>
</cfoutput>
</html> |