<cfscript>
// ChartDirector for ColdFusion API Access Point
cd = CreateObject("java", "ChartDirector.CFChart");
// A utility to allow us to create arrays with data in one line of code
function Array() {
var result = ArrayNew(1);
var i = 0;
for (i = 1; i LTE ArrayLen(arguments); i = i + 1)
result[i] = arguments[i];
return result;
}
// The data for the chart
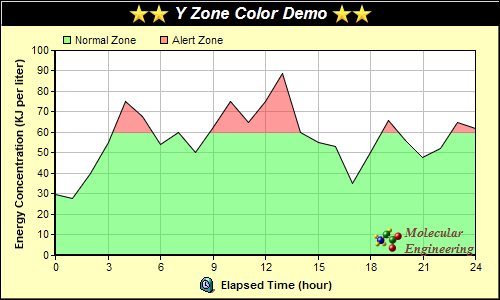
data = Array(30, 28, 40, 55, 75, 68, 54, 60, 50, 62, 75, 65, 75, 89, 60, 55, 53, 35, 50, 66, 56, 48,
52, 65, 62);
// The labels for the chart
labels = Array("0", "1", "2", "3", "4", "5", "6", "7", "8", "9", "10", "11", "12", "13", "14", "15",
"16", "17", "18", "19", "20", "21", "22", "23", "24");
// Create a XYChart object of size 500 x 300 pixels, with a pale yellow (0xffffc0) background, a
// black border, and 1 pixel 3D border effect
c = cd.XYChart(500, 300, "0xffffc0", "0x000000", 1);
// Set search path to current directory for loading icon images
c.setSearchPath(GetPageContext());
// Set the plotarea at (55, 50) and of size 420 x 205 pixels, with white background. Turn on both
// horizontal and vertical grid lines with light grey color (0xc0c0c0)
c.setPlotArea(55, 50, 420, 205, "0xffffff").setGridColor("0xc0c0c0", "0xc0c0c0");
// Add a legend box at (55, 25) (top of the chart) with horizontal layout. Use 8pt Arial font. Set
// the background and border color to Transparent.
legendBox = c.addLegend(55, 25, False, "", 8);
legendBox.setBackground(cd.Transparent);
// Add keys to the legend box to explain the color zones
legendBox.addKey("Normal Zone", "0x8033ff33");
legendBox.addKey("Alert Zone", "0x80ff3333");
// Add a title box to the chart using 13pt Arial Bold Italic font. The title is in CDML and includes
// embedded images for highlight. The text is white (0xffffff) on a black background, with a 1 pixel
// 3D border.
c.addTitle(
"<*block,valign=absmiddle*><*img=star.png*><*img=star.png*> Y Zone Color Demo " &
"<*img=star.png*><*img=star.png*><*/*>", "Arial Bold Italic", 13, "0xffffff").setBackground(
"0x000000", -1, 1);
// Add a title to the y axis
c.yAxis().setTitle("Energy Concentration (KJ per liter)");
// Set the labels on the x axis.
c.xAxis().setLabels(labels);
// Display 1 out of 3 labels on the x-axis.
c.xAxis().setLabelStep(3);
// Add a title to the x axis using CDML
c.xAxis().setTitle("<*block,valign=absmiddle*><*img=clock.png*> Elapsed Time (hour)<*/*>");
// Set the axes width to 2 pixels
c.xAxis().setWidth(2);
c.yAxis().setWidth(2);
// Add an area layer to the chart. The area is using a y zone color, where the color is
// semi-transparent green below 60, and semi-transparent red above 60.
c.addAreaLayer(data, c.yZoneColor(60, "0x8033ff33", "0x80ff3333"));
// Add a custom CDML text at the bottom right of the plot area as the logo
c.addText(475, 255,
"<*block,valign=absmiddle*><*img=small_molecule.png*> <*block*><*font=Times New Roman Bold " &
"Italic,size=10,color=804040*>Molecular<*br*>Engineering<*/*>").setAlignment(cd.BottomRight);
// Output the chart
chart1URL = c.makeSession(GetPageContext(), "chart1");
// Include tool tip for the chart
imageMap1 = c.getHTMLImageMap("", "", "title='Hour {xLabel}: {value} KJ/liter'");
</cfscript>
<html>
<body style="margin:5px 0px 0px 5px">
<div style="font-size:18pt; font-family:verdana; font-weight:bold">
Y Zone Coloring
</div>
<hr style="border:solid 1px #000080" />
<cfoutput>
<div style="font-size:9pt; font-family:verdana; margin-bottom:1.5em">
<a href='viewsource.cfm?file=#CGI.SCRIPT_NAME#'>View Source Code</a>
</div>
<img src="getchart.cfm?#chart1URL#" usemap="##map1" border="0" />
<map name="map1">#imageMap1#</map>
</cfoutput>
</body>
</html> |