[Web Version (in ASP)] aspdemo\blacksemicirclemeter.asp
<%@ language="vbscript" %>
<%
Set cd = CreateObject("ChartDirector.API")
' This script can draw different charts depending on the chartIndex
Sub createChart(viewer, chartIndex)
' The value to display on the meter
value = 72.55
' Create an AngularMeter object of size 300 x 180 pixels with transparent background
Set m = cd.AngularMeter(300, 180, cd.Transparent)
' Set the default text and line colors to white (0xffffff)
Call m.setColor(cd.TextColor, &Hffffff)
Call m.setColor(cd.LineColor, &Hffffff)
' Center at (150, 150), scale radius = 128 pixels, scale angle -90 to +90 degrees
Call m.setMeter(150, 150, 128, -90, 90)
' Gradient color for the border to make it silver-like
ringGradient = Array(1, &H909090, 0.5, &Hd6d6d6, 0, &Heeeeee, -0.5, &Hd6d6d6, -1, &H909090)
' Add a black (0x000000) scale background of 148 pixels radius with a 10 pixel thick silver
' border
Call m.addScaleBackground(148, 0, 10, m.relativeLinearGradient(ringGradient, 45, 148))
' Meter scale is 0 - 100, with major tick every 20 units, minor tick every 10 units, and micro
' tick every 5 units
Call m.setScale(0, 100, 20, 10, 5)
' Set the scale label style to 15pt Arial Italic. Set the major/minor/micro tick lengths to
' 16/16/10 pixels pointing inwards, and their widths to 2/1/1 pixels.
Call m.setLabelStyle("Arial Italic", 16)
Call m.setTickLength(-16, -16, -10)
Call m.setLineWidth(0, 2, 1, 1)
' Demostrate different types of color scales and putting them at different positions
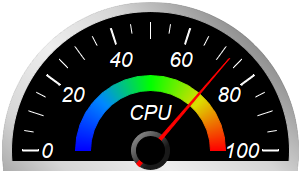
smoothColorScale = Array(0, &H0000ff, 25, &H0088ff, 50, &H00ff00, 75, &Hdddd00, 100, &Hff0000)
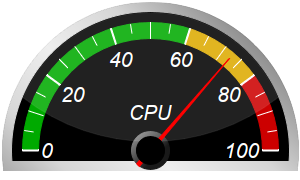
stepColorScale = Array(0, &H00aa00, 60, &Hddaa00, 80, &Hcc0000, 100)
highLowColorScale = Array(0, &H00ff00, 70, cd.Transparent, 100, &Hff0000)
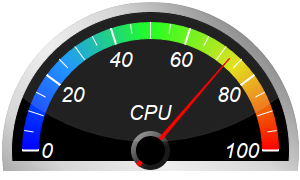
If chartIndex = 0 Then
' Add the smooth color scale at the default position
Call m.addColorScale(smoothColorScale)
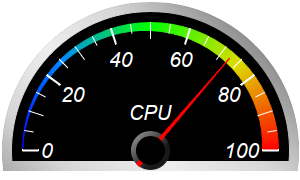
ElseIf chartIndex = 1 Then
' Add the smooth color scale starting at radius 128 with zero width and ending at radius 128
' with 16 pixels inner width
Call m.addColorScale(smoothColorScale, 128, 0, 128, -16)
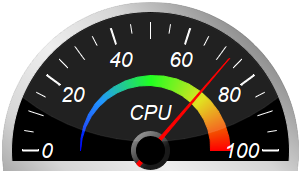
ElseIf chartIndex = 2 Then
' Add the smooth color scale starting at radius 70 with zero width and ending at radius 60
' with 20 pixels outer width
Call m.addColorScale(smoothColorScale, 70, 0, 60, 20)
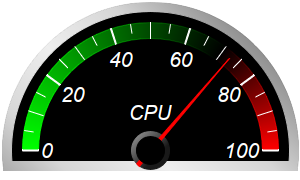
ElseIf chartIndex = 3 Then
' Add the high/low color scale at the default position
Call m.addColorScale(highLowColorScale)
ElseIf chartIndex = 4 Then
' Add the step color scale at the default position
Call m.addColorScale(stepColorScale)
Else
' Add the smooth color scale at radius 60 with 15 pixels outer width
Call m.addColorScale(smoothColorScale, 60, 15)
End If
' Add a text label centered at (150, 125) with 15pt Arial Italic font
Call m.addText(150, 125, "CPU", "Arial Italic", 15, cd.TextColor, cd.BottomCenter)
' Add a red (0xff0000) pointer at the specified value
Call m.addPointer2(value, &Hff0000)
' Add glare up to radius 138 (= region inside border)
If chartIndex Mod 2 = 0 Then
Call m.addGlare(138)
End If
' Output the chart
Call viewer.setChart(m, cd.SVG)
End Sub
' This example includes 6 charts
Dim viewers(5)
For i = 0 To Ubound(viewers)
Set viewers(i) = cd.WebChartViewer(Request, "chart" & i)
Call createChart(viewers(i), i)
Next
%>
<!DOCTYPE html>
<html>
<head>
<title>Black Semicircle Meters</title>
<!-- Include ChartDirector Javascript Library to support chart interactions -->
<script type="text/javascript" src="cdjcv.js"></script>
</head>
<body style="margin:5px 0px 0px 5px">
<div style="font:bold 18pt verdana;">
Black Semicircle Meters
</div>
<hr style="border:solid 1px #000080; background:#000080" />
<div style="font:10pt verdana; margin-bottom:1.5em">
<a href="viewsource.asp?file=<%= Request("SCRIPT_NAME") %>">View Chart Source Code</a>
</div>
<!-- ****** Here are the chart images ****** -->
<%
For i = 0 To Ubound(viewers)
Call Response.Write(viewers(i).renderHTML())
Call Response.Write(" ")
Next
%>
</body>
</html>
[Windows Version (in Visual Basic)] vbdemo\blacksemicirclemeter.cls
Public Sub createChart(viewer As Object, chartIndex As Integer)

    Dim cd As New ChartDirector.API

    ' The value to display on the meter
    Dim value As Double
    value = 72.55

    ' Create an AngularMeter object of size 300 x 180 pixels
    Dim m As AngularMeter
    Set m = cd.AngularMeter(300, 180)

    ' Set the default text and line colors to white (0xffffff)
    Call m.setColor(cd.TextColor, &Hffffff)
    Call m.setColor(cd.LineColor, &Hffffff)

    ' Center at (150, 150), scale radius = 128 pixels, scale angle -90 to +90 degrees
    Call m.setMeter(150, 150, 128, -90, 90)

    ' Gradient color for the border to make it silver-like
    Dim ringGradient()
    ringGradient = Array(1, &H909090, 0.5, &Hd6d6d6, 0, &Heeeeee, -0.5, &Hd6d6d6, -1, &H909090)

    ' Add a black (0x000000) scale background of 148 pixels radius with a 10 pixel thick silver
    ' border
    Call m.addScaleBackground(148, 0, 10, m.relativeLinearGradient(ringGradient, 45, 148))

    ' Meter scale is 0 - 100, with major tick every 20 units, minor tick every 10 units, and micro
    ' tick every 5 units
    Call m.setScale(0, 100, 20, 10, 5)

    ' Set the scale label style to 15pt Arial Italic. Set the major/minor/micro tick lengths to
    ' 16/16/10 pixels pointing inwards, and their widths to 2/1/1 pixels.
    Call m.setLabelStyle("ariali.ttf", 16)
    Call m.setTickLength(-16, -16, -10)
    Call m.setLineWidth(0, 2, 1, 1)

    ' Demostrate different types of color scales and putting them at different positions
    Dim smoothColorScale()
    smoothColorScale = Array(0, &H0000ff, 25, &H0088ff, 50, &H00ff00, 75, &Hdddd00, 100, &Hff0000)
    Dim stepColorScale()
    stepColorScale = Array(0, &H00aa00, 60, &Hddaa00, 80, &Hcc0000, 100)
    Dim highLowColorScale()
    highLowColorScale = Array(0, &H00ff00, 70, cd.Transparent, 100, &Hff0000)

    If chartIndex = 0 Then
        ' Add the smooth color scale at the default position
        Call m.addColorScale(smoothColorScale)
    ElseIf chartIndex = 1 Then
        ' Add the smooth color scale starting at radius 128 with zero width and ending at radius 128
        ' with 16 pixels inner width
        Call m.addColorScale(smoothColorScale, 128, 0, 128, -16)
    ElseIf chartIndex = 2 Then
        ' Add the smooth color scale starting at radius 70 with zero width and ending at radius 60
        ' with 20 pixels outer width
        Call m.addColorScale(smoothColorScale, 70, 0, 60, 20)
    ElseIf chartIndex = 3 Then
        ' Add the high/low color scale at the default position
        Call m.addColorScale(highLowColorScale)
    ElseIf chartIndex = 4 Then
        ' Add the step color scale at the default position
        Call m.addColorScale(stepColorScale)
    Else
        ' Add the smooth color scale at radius 60 with 15 pixels outer width
        Call m.addColorScale(smoothColorScale, 60, 15)
    End If

    ' Add a text label centered at (150, 125) with 15pt Arial Italic font
    Call m.addText(150, 125, "CPU", "ariali.ttf", 15, cd.TextColor, cd.BottomCenter)

    ' Add a red (0xff0000) pointer at the specified value
    Call m.addPointer2(value, &Hff0000)

    ' Add glare up to radius 138 (= region inside border)
    If chartIndex Mod 2 = 0 Then
        Call m.addGlare(138)
    End If

    ' Output the chart
    Set viewer.Picture = m.makePicture()

End Sub
© 2021 Advanced Software Engineering Limited. All rights reserved.