This example demonstrates vertical bar meters in a black coloring scheme, and with bars in various shading styles.
ChartDirector 7.0 (ASP/COM/VB Edition)
Black Vertical Bar Meters
Source Code Listing
<%@ language="vbscript" %>
<%
Set cd = CreateObject("ChartDirector.API")
' This script can draw different charts depending on the chartIndex
Sub createChart(viewer, chartIndex)
' The value to display on the meter
value = 66.77
' Create a LinearMeter object of size 70 x 260 pixels with black background and rounded corners
Set m = cd.LinearMeter(70, 260, &H000000)
Call m.setRoundedFrame(cd.Transparent)
' Set the default text and line colors to white (0xffffff)
Call m.setColor(cd.TextColor, &Hffffff)
Call m.setColor(cd.LineColor, &Hffffff)
' Set the scale region top-left corner at (36, 30), with size of 20 x 196 pixels. The scale
' labels are located on the left (default - implies vertical meter).
Call m.setMeter(36, 30, 20, 196)
' Set meter scale from 0 - 100, with a tick every 10 units
Call m.setScale(0, 100, 10)
' Add the chart title at the top center
Set title = m.addText(m.getWidth() / 2, 5, "Temp C", "Arial Bold", 8, cd.TextColor, _
cd.TopCenter)
' Move the scale labels 8 pixels from the meter scale to make room for the color scale
Call m.setLabelPos(False, 8)
' Demostrate different types of color scales
smoothColorScale = Array(0, &H0000ff, 25, &H0088ff, 50, &H00ff00, 75, &Hdddd00, 100, &Hff0000)
stepColorScale = Array(0, &H00dd00, 50, &Hffff00, 80, &Hff0000, 100)
highLowColorScale = Array(0, &H0000ff, 40, cd.Transparent, 60, cd.Transparent, 100, &Hff0000)
highColorScale = Array(70, cd.Transparent, 100, &Hff0000)
If chartIndex = 0 Then
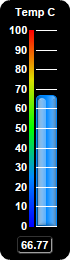
' Add a blue (0x0088ff) bar from 0 to value with glass effect and 4 pixel rounded corners
Call m.addBar(0, value, &H0088ff, cd.glassEffect(cd.NormalGlare, cd.Left), 4)
' Add a 4-pixel thick smooth color scale at x = 29 (left of meter scale)
Call m.addColorScale(smoothColorScale, 29, 4)
ElseIf chartIndex = 1 Then
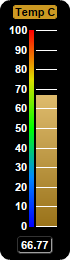
' Add a yellow (0xCC9922) bar from 0 to value with bar lighting effect
Call m.addBar(0, value, &Hcc9922, cd.barLighting())
' Add a 4-pixel thick smooth color scale at x = 29 (left of meter scale)
Call m.addColorScale(smoothColorScale, 29, 4)
' Set the title style to black text on a yellow (0xcc9922) background with rounded corners
Call title.setFontColor(&H000000)
Call title.setBackground(&Hcc9922)
Call title.setRoundedCorners(2)
ElseIf chartIndex = 2 Then
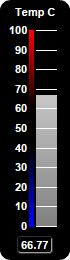
' Add a grey (0xaaaaaa) bar from 0 to value with bar lighting effect
Call m.addBar(0, value, &Haaaaaa, cd.barLighting())
' Add a 4-pixel high/low color scale at x = 29 (left of meter scale)
Call m.addColorScale(highLowColorScale, 29, 4)
ElseIf chartIndex = 3 Then
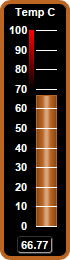
' Add a brown (0xbb6622) bar from 0 to value with cylinder lighting effect
Call m.addBar(0, value, &Hbb6622, cd.cylinderEffect())
' Add a 4 pixel thick brown (0xbb6622) frame
Call m.setThickFrame(4, &Hbb6622)
' Add a high only color scale at x = 29 (left of meter scale)
Call m.addColorScale(highColorScale, 29, 4)
ElseIf chartIndex = 4 Then
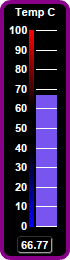
' Add a purple (0x7755ee) bar from 0 to value
Call m.addBar(0, value, &H7755ee)
' Add a 4 pixel thick purple (0x880088) frame
Call m.setThickFrame(4, &H880088)
' Add a 4-pixel high/low color scale at x = 29 (left of meter scale)
Call m.addColorScale(highLowColorScale, 29, 4)
Else
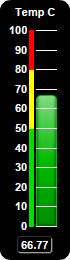
' Add a green (0x00bb00) bar from 0 to value with soft lighting effect and 4 pixel rounded
' corners
Call m.addBar(0, value, &H00bb00, cd.softLighting(), 4)
' Add a 4-pixel step color scale at x = 29 (left of meter scale)
Call m.addColorScale(stepColorScale, 29, 4)
End If
' Add a text box at the bottom-center. Display the value using white (0xffffff) 8pt Arial Bold
' font on a black (0x000000) background with depressed grey (0x333333) rounded border.
Set t = m.addText(m.getWidth() / 2, m.getHeight() - 7, m.formatValue(value, "2"), _
"Arial Bold", 8, &Hffffff, cd.BottomCenter)
Call t.setBackground(&H000000, &H333333, -1)
Call t.setRoundedCorners(3)
' Output the chart
Call viewer.setChart(m, cd.SVG)
End Sub
' This example includes 6 charts
Dim viewers(5)
For i = 0 To Ubound(viewers)
Set viewers(i) = cd.WebChartViewer(Request, "chart" & i)
Call createChart(viewers(i), i)
Next
%>
<!DOCTYPE html>
<html>
<head>
<title>Black Vertical Bar Meters</title>
<!-- Include ChartDirector Javascript Library to support chart interactions -->
<script type="text/javascript" src="cdjcv.js"></script>
</head>
<body style="margin:5px 0px 0px 5px">
<div style="font:bold 18pt verdana;">
Black Vertical Bar Meters
</div>
<hr style="border:solid 1px #000080; background:#000080" />
<div style="font:10pt verdana; margin-bottom:1.5em">
<a href="viewsource.asp?file=<%= Request("SCRIPT_NAME") %>">View Chart Source Code</a>
</div>
<!-- ****** Here are the chart images ****** -->
<%
For i = 0 To Ubound(viewers)
Call Response.Write(viewers(i).renderHTML())
Call Response.Write(" ")
Next
%>
</body>
</html>Public Sub createChart(viewer As Object, chartIndex As Integer)
Dim cd As New ChartDirector.API
' The value to display on the meter
Dim value As Double
value = 66.77
' Create a LinearMeter object of size 70 x 260 pixels with black background and rounded corners
Dim m As LinearMeter
Set m = cd.LinearMeter(70, 260, &H000000)
Call m.setRoundedFrame()
' Set the default text and line colors to white (0xffffff)
Call m.setColor(cd.TextColor, &Hffffff)
Call m.setColor(cd.LineColor, &Hffffff)
' Set the scale region top-left corner at (36, 30), with size of 20 x 196 pixels. The scale
' labels are located on the left (default - implies vertical meter).
Call m.setMeter(36, 30, 20, 196)
' Set meter scale from 0 - 100, with a tick every 10 units
Call m.setScale(0, 100, 10)
' Add the chart title at the top center
Dim title As ChartDirector.TextBox
Set title = m.addText(m.getWidth() / 2, 5, "Temp C", "arialbd.ttf", 8, cd.TextColor, _
cd.TopCenter)
' Move the scale labels 8 pixels from the meter scale to make room for the color scale
Call m.setLabelPos(False, 8)
' Demostrate different types of color scales
Dim smoothColorScale()
smoothColorScale = Array(0, &H0000ff, 25, &H0088ff, 50, &H00ff00, 75, &Hdddd00, 100, &Hff0000)
Dim stepColorScale()
stepColorScale = Array(0, &H00dd00, 50, &Hffff00, 80, &Hff0000, 100)
Dim highLowColorScale()
highLowColorScale = Array(0, &H0000ff, 40, cd.Transparent, 60, cd.Transparent, 100, &Hff0000)
Dim highColorScale()
highColorScale = Array(70, cd.Transparent, 100, &Hff0000)
If chartIndex = 0 Then
' Add a blue (0x0088ff) bar from 0 to value with glass effect and 4 pixel rounded corners
Call m.addBar(0, value, &H0088ff, cd.glassEffect(cd.NormalGlare, cd.Left), 4)
' Add a 4-pixel thick smooth color scale at x = 29 (left of meter scale)
Call m.addColorScale(smoothColorScale, 29, 4)
ElseIf chartIndex = 1 Then
' Add a yellow (0xCC9922) bar from 0 to value with bar lighting effect
Call m.addBar(0, value, &Hcc9922, cd.barLighting())
' Add a 4-pixel thick smooth color scale at x = 29 (left of meter scale)
Call m.addColorScale(smoothColorScale, 29, 4)
' Set the title style to black text on a yellow (0xcc9922) background with rounded corners
Call title.setFontColor(&H000000)
Call title.setBackground(&Hcc9922)
Call title.setRoundedCorners(2)
ElseIf chartIndex = 2 Then
' Add a grey (0xaaaaaa) bar from 0 to value with bar lighting effect
Call m.addBar(0, value, &Haaaaaa, cd.barLighting())
' Add a 4-pixel high/low color scale at x = 29 (left of meter scale)
Call m.addColorScale(highLowColorScale, 29, 4)
ElseIf chartIndex = 3 Then
' Add a brown (0xbb6622) bar from 0 to value with cylinder lighting effect
Call m.addBar(0, value, &Hbb6622, cd.cylinderEffect())
' Add a 4 pixel thick brown (0xbb6622) frame
Call m.setThickFrame(4, &Hbb6622)
' Add a high only color scale at x = 29 (left of meter scale)
Call m.addColorScale(highColorScale, 29, 4)
ElseIf chartIndex = 4 Then
' Add a purple (0x7755ee) bar from 0 to value
Call m.addBar(0, value, &H7755ee)
' Add a 4 pixel thick purple (0x880088) frame
Call m.setThickFrame(4, &H880088)
' Add a 4-pixel high/low color scale at x = 29 (left of meter scale)
Call m.addColorScale(highLowColorScale, 29, 4)
Else
' Add a green (0x00bb00) bar from 0 to value with soft lighting effect and 4 pixel rounded
' corners
Call m.addBar(0, value, &H00bb00, cd.softLighting(), 4)
' Add a 4-pixel step color scale at x = 29 (left of meter scale)
Call m.addColorScale(stepColorScale, 29, 4)
End If
' Add a text box at the bottom-center. Display the value using white (0xffffff) 8pt Arial Bold
' font on a black (0x000000) background with depressed grey (0x333333) rounded border.
Dim t As ChartDirector.TextBox
Set t = m.addText(m.getWidth() / 2, m.getHeight() - 7, m.formatValue(value, "2"), _
"arialbd.ttf", 8, &Hffffff, cd.BottomCenter)
Call t.setBackground(&H000000, &H333333, -1)
Call t.setRoundedCorners(3)
' Output the chart
Set viewer.Picture = m.makePicture()
End Sub