This example demonstrates label positioning in the "circular label layout" method.
By default, in "circular label layout", the sector labels will be external and close to the pie perimeter.
The
PieChart.setLabelPos method can be used to control the distance between the labels and the pie perimeter, and add join lines to connect the labels to the sectors. The join lines are useful if the labels are far away from the pie perimeter.
The distance between the sector labels and the pie perimeter can be negative, in which case the labels will be internal to the pie.
[Web Version (in ASP)] aspdemo\circlelabelpie.asp
<%@ language="vbscript" %>
<%
Set cd = CreateObject("ChartDirector.API")
' This script can draw different charts depending on the chartIndex
Sub createChart(viewer, chartIndex)
' The data for the pie chart
data = Array(42, 18, 8)
' The labels for the pie chart
labels = Array("Agree", "Disagree", "Not Sure")
' The colors to use for the sectors
colors = Array(&H66ff66, &Hff6666, &Hffff00)
' Create a PieChart object of size 300 x 300 pixels. Set the background to a gradient color from
' blue (aaccff) to sky blue (ffffff), with a grey (888888) border. Use rounded corners and soft
' drop shadow.
Set c = cd.PieChart(300, 300)
Call c.setBackground(c.linearGradientColor(0, 0, 0, c.getHeight() / 2, &Haaccff, &Hffffff), _
&H888888)
Call c.setRoundedFrame()
Call c.setDropShadow()
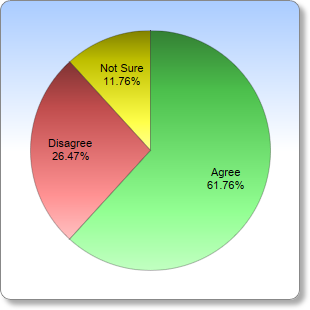
If chartIndex = 0 Then
'============================================================
' Draw a pie chart where the label is on top of the pie
'============================================================
' Set the center of the pie at (150, 150) and the radius to 120 pixels
Call c.setPieSize(150, 150, 120)
' Set the label position to -40 pixels from the perimeter of the pie (-ve means label is
' inside the pie)
Call c.setLabelPos(-40)
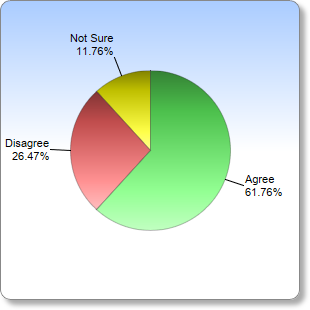
Else
'============================================================
' Draw a pie chart where the label is outside the pie
'============================================================
' Set the center of the pie at (150, 150) and the radius to 80 pixels
Call c.setPieSize(150, 150, 80)
' Set the sector label position to be 20 pixels from the pie. Use a join line to connect the
' labels to the sectors.
Call c.setLabelPos(20, cd.LineColor)
End If
' Set the pie data and the pie labels
Call c.setData(data, labels)
' Set the sector colors
Call c.setColors2(cd.DataColor, colors)
' Use local gradient shading, with a 1 pixel semi-transparent black (bb000000) border
Call c.setSectorStyle(cd.LocalGradientShading, &Hbb000000, 1)
' Output the chart
Call viewer.setChart(c, cd.SVG)
' Include tool tip for the chart
viewer.ImageMap = c.getHTMLImageMap("", "", "title='{label}: {value} responses ({percent}%)'")
End Sub
' This example includes 2 charts
Dim viewers(1)
For i = 0 To Ubound(viewers)
Set viewers(i) = cd.WebChartViewer(Request, "chart" & i)
Call createChart(viewers(i), i)
Next
%>
<!DOCTYPE html>
<html>
<head>
<title>Circular Label Layout</title>
<!-- Include ChartDirector Javascript Library to support chart interactions -->
<script type="text/javascript" src="cdjcv.js"></script>
</head>
<body style="margin:5px 0px 0px 5px">
<div style="font:bold 18pt verdana;">
Circular Label Layout
</div>
<hr style="border:solid 1px #000080; background:#000080" />
<div style="font:10pt verdana; margin-bottom:1.5em">
<a href="viewsource.asp?file=<%= Request("SCRIPT_NAME") %>">View Chart Source Code</a>
</div>
<!-- ****** Here are the chart images ****** -->
<%
For i = 0 To Ubound(viewers)
Call Response.Write(viewers(i).renderHTML())
Call Response.Write(" ")
Next
%>
</body>
</html>
[Windows Version (in Visual Basic)] vbdemo\circlelabelpie.cls
Public Sub createChart(viewer As Object, chartIndex As Integer)

    Dim cd As New ChartDirector.API

    ' The data for the pie chart
    Dim data()
    data = Array(42, 18, 8)

    ' The labels for the pie chart
    Dim labels()
    labels = Array("Agree", "Disagree", "Not Sure")

    ' The colors to use for the sectors
    Dim colors()
    colors = Array(&H66ff66, &Hff6666, &Hffff00)

    ' Create a PieChart object of size 300 x 300 pixels. Set the background to a gradient color from
    ' blue (aaccff) to sky blue (ffffff), with a grey (888888) border. Use rounded corners and soft
    ' drop shadow.
    Dim c As PieChart
    Set c = cd.PieChart(300, 300)
    Call c.setBackground(c.linearGradientColor(0, 0, 0, c.getHeight() / 2, &Haaccff, &Hffffff), _
        &H888888)
    Call c.setRoundedFrame()
    Call c.setDropShadow()

    If chartIndex = 0 Then
    '============================================================
    '    Draw a pie chart where the label is on top of the pie
    '============================================================

        ' Set the center of the pie at (150, 150) and the radius to 120 pixels
        Call c.setPieSize(150, 150, 120)

        ' Set the label position to -40 pixels from the perimeter of the pie (-ve means label is
        ' inside the pie)
        Call c.setLabelPos(-40)

    Else
    '============================================================
    '    Draw a pie chart where the label is outside the pie
    '============================================================

        ' Set the center of the pie at (150, 150) and the radius to 80 pixels
        Call c.setPieSize(150, 150, 80)

        ' Set the sector label position to be 20 pixels from the pie. Use a join line to connect the
        ' labels to the sectors.
        Call c.setLabelPos(20, cd.LineColor)

    End If

    ' Set the pie data and the pie labels
    Call c.setData(data, labels)

    ' Set the sector colors
    Call c.setColors2(cd.DataColor, colors)

    ' Use local gradient shading, with a 1 pixel semi-transparent black (bb000000) border
    Call c.setSectorStyle(cd.LocalGradientShading, &Hbb000000, 1)

    ' Output the chart
    Set viewer.Picture = c.makePicture()

    'include tool tip for the chart
    viewer.ImageMap = c.getHTMLImageMap("clickable", "", _
        "title='{label}: {value} responses ({percent}%)'")

End Sub
© 2021 Advanced Software Engineering Limited. All rights reserved.