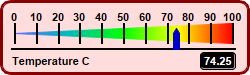
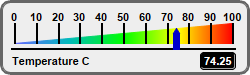
This example demonstrates horizontal linear meters in various colors, with different color scales, and with title and value readout.
BaseMeter.addColorScale is used to create the color scales in the meters. The color scales are created by with different colors, different end point positions and different widths at the end points.
The title and value readout are created using
BaseChart.addText. The value readout is configured to have a black background and a depressed border using
Box.setBackground, and with rounded corners using
Box.setRoundedCorners.
[Web Version (in ASP)] aspdemo\colorhlinearmeter.asp
<%@ language="vbscript" %>
<%
Set cd = CreateObject("ChartDirector.API")
' This script can draw different charts depending on the chartIndex
Sub createChart(viewer, chartIndex)
' The value to display on the meter
value = 74.25
' The background and border colors of the meters
bgColor = Array(&Hbbddff, &Hccffcc, &Hffccff, &Hffffaa, &Hffdddd, &Heeeeee)
borderColor = Array(&H000088, &H006600, &H6600aa, &Hee6600, &H880000, &H666666)
' Create a LinearMeter object of size 250 x 75 pixels with a 3-pixel thick rounded frame
Set m = cd.LinearMeter(250, 75, bgColor(chartIndex), borderColor(chartIndex))
Call m.setRoundedFrame(cd.Transparent)
Call m.setThickFrame(3)
' Set the scale region top-left corner at (14, 23), with size of 218 x 20 pixels. The scale
' labels are located on the top (implies horizontal meter)
Call m.setMeter(14, 23, 218, 20, cd.Top)
' Set meter scale from 0 - 100, with a tick every 10 units
Call m.setScale(0, 100, 10)
' Demostrate different types of color scales and putting them at different positions
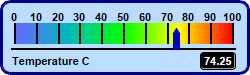
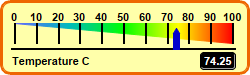
smoothColorScale = Array(0, &H6666ff, 25, &H00bbbb, 50, &H00ff00, 75, &Hffff00, 100, &Hff0000)
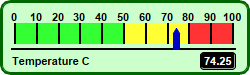
stepColorScale = Array(0, &H33ff33, 50, &Hffff33, 80, &Hff3333, 100)
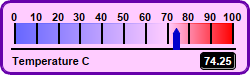
highLowColorScale = Array(0, &H6666ff, 70, cd.Transparent, 100, &Hff0000)
If chartIndex = 0 Then
' Add the smooth color scale at the default position
Call m.addColorScale(smoothColorScale)
ElseIf chartIndex = 1 Then
' Add the step color scale at the default position
Call m.addColorScale(stepColorScale)
ElseIf chartIndex = 2 Then
' Add the high low scale at the default position
Call m.addColorScale(highLowColorScale)
ElseIf chartIndex = 3 Then
' Add the smooth color scale starting at y = 23 (top of scale) with zero width and ending at
' y = 23 with 20 pixels width
Call m.addColorScale(smoothColorScale, 23, 0, 23, 20)
ElseIf chartIndex = 4 Then
' Add the smooth color scale starting at y = 33 (center of scale) with zero width and ending
' at y = 23 with 20 pixels width
Call m.addColorScale(smoothColorScale, 33, 0, 23, 20)
Else
' Add the smooth color scale starting at y = 43 (bottom of scale) with zero width and ending
' at y = 23 with 20 pixels width
Call m.addColorScale(smoothColorScale, 43, 0, 23, 20)
End If
' Add a blue (0x0000cc) pointer at the specified value
Call m.addPointer(value, &H0000cc)
' Add a label left aligned to (10, 61) using 8pt Arial Bold font
Call m.addText(10, 61, "Temperature C", "Arial Bold", 8, cd.TextColor, cd.Left)
' Add a text box right aligned to (235, 61). Display the value using white (0xffffff) 8pt Arial
' Bold font on a black (0x000000) background with depressed rounded border.
Set t = m.addText(235, 61, m.formatValue(value, "2"), "Arial Bold", 8, &Hffffff, cd.Right)
Call t.setBackground(&H000000, &H000000, -1)
Call t.setRoundedCorners(3)
' Output the chart
Call viewer.setChart(m, cd.SVG)
End Sub
' This example includes 6 charts
Dim viewers(5)
For i = 0 To Ubound(viewers)
Set viewers(i) = cd.WebChartViewer(Request, "chart" & i)
Call createChart(viewers(i), i)
Next
%>
<!DOCTYPE html>
<html>
<head>
<title>Color Horizontal Linear Meters</title>
<!-- Include ChartDirector Javascript Library to support chart interactions -->
<script type="text/javascript" src="cdjcv.js"></script>
</head>
<body style="margin:5px 0px 0px 5px">
<div style="font:bold 18pt verdana;">
Color Horizontal Linear Meters
</div>
<hr style="border:solid 1px #000080; background:#000080" />
<div style="font:10pt verdana; margin-bottom:1.5em">
<a href="viewsource.asp?file=<%= Request("SCRIPT_NAME") %>">View Chart Source Code</a>
</div>
<!-- ****** Here are the chart images ****** -->
<%
For i = 0 To Ubound(viewers)
Call Response.Write(viewers(i).renderHTML())
Call Response.Write(" ")
Next
%>
</body>
</html>
[Windows Version (in Visual Basic)] vbdemo\colorhlinearmeter.cls
Public Sub createChart(viewer As Object, chartIndex As Integer)

    Dim cd As New ChartDirector.API

    ' The value to display on the meter
    Dim value As Double
    value = 74.25

    ' The background and border colors of the meters
    Dim bgColor()
    bgColor = Array(&Hbbddff, &Hccffcc, &Hffccff, &Hffffaa, &Hffdddd, &Heeeeee)
    Dim borderColor()
    borderColor = Array(&H000088, &H006600, &H6600aa, &Hee6600, &H880000, &H666666)

    ' Create a LinearMeter object of size 250 x 75 pixels with a 3-pixel thick rounded frame
    Dim m As LinearMeter
    Set m = cd.LinearMeter(250, 75, bgColor(chartIndex), borderColor(chartIndex))
    Call m.setRoundedFrame()
    Call m.setThickFrame(3)

    ' Set the scale region top-left corner at (14, 23), with size of 218 x 20 pixels. The scale
    ' labels are located on the top (implies horizontal meter)
    Call m.setMeter(14, 23, 218, 20, cd.Top)

    ' Set meter scale from 0 - 100, with a tick every 10 units
    Call m.setScale(0, 100, 10)

    ' Demostrate different types of color scales and putting them at different positions
    Dim smoothColorScale()
    smoothColorScale = Array(0, &H6666ff, 25, &H00bbbb, 50, &H00ff00, 75, &Hffff00, 100, &Hff0000)
    Dim stepColorScale()
    stepColorScale = Array(0, &H33ff33, 50, &Hffff33, 80, &Hff3333, 100)
    Dim highLowColorScale()
    highLowColorScale = Array(0, &H6666ff, 70, cd.Transparent, 100, &Hff0000)

    If chartIndex = 0 Then
        ' Add the smooth color scale at the default position
        Call m.addColorScale(smoothColorScale)
    ElseIf chartIndex = 1 Then
        ' Add the step color scale at the default position
        Call m.addColorScale(stepColorScale)
    ElseIf chartIndex = 2 Then
        ' Add the high low scale at the default position
        Call m.addColorScale(highLowColorScale)
    ElseIf chartIndex = 3 Then
        ' Add the smooth color scale starting at y = 23 (top of scale) with zero width and ending at
        ' y = 23 with 20 pixels width
        Call m.addColorScale(smoothColorScale, 23, 0, 23, 20)
    ElseIf chartIndex = 4 Then
        ' Add the smooth color scale starting at y = 33 (center of scale) with zero width and ending
        ' at y = 23 with 20 pixels width
        Call m.addColorScale(smoothColorScale, 33, 0, 23, 20)
    Else
        ' Add the smooth color scale starting at y = 43 (bottom of scale) with zero width and ending
        ' at y = 23 with 20 pixels width
        Call m.addColorScale(smoothColorScale, 43, 0, 23, 20)
    End If

    ' Add a blue (0x0000cc) pointer at the specified value
    Call m.addPointer(value, &H0000cc)

    ' Add a label left aligned to (10, 61) using 8pt Arial Bold font
    Call m.addText(10, 61, "Temperature C", "arialbd.ttf", 8, cd.TextColor, cd.Left)

    ' Add a text box right aligned to (235, 61). Display the value using white (0xffffff) 8pt Arial
    ' Bold font on a black (0x000000) background with depressed rounded border.
    Dim t As ChartDirector.TextBox
    Set t = m.addText(235, 61, m.formatValue(value, "2"), "arialbd.ttf", 8, &Hffffff, cd.Right)
    Call t.setBackground(&H000000, &H000000, -1)
    Call t.setRoundedCorners(3)

    ' Output the chart
    Set viewer.Picture = m.makePicture()

End Sub
© 2021 Advanced Software Engineering Limited. All rights reserved.