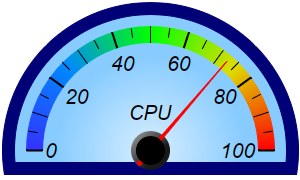
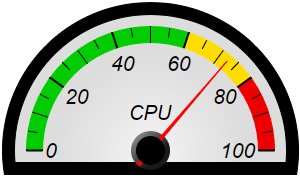
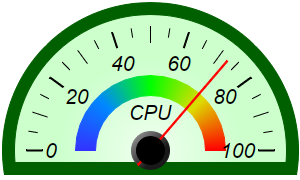
This example demonstrates semicircle meters in various gradient colors, as well as various color scales and pointer types.
The background color in this example changes from a specified color at the border, to a brighter version of the color at the center. The brighter color is derived from the specified color using
BaseChart.adjustBrightness. To achieve the radial gradient effect, these two colors are passed to
AngularMeter.relativeRadialGradient to create a radial gradient color. The gradient color is then passed to
AngularMeter.addScaleBackground to fill the background.
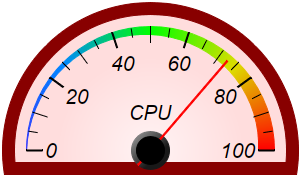
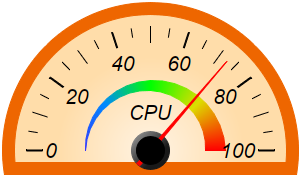
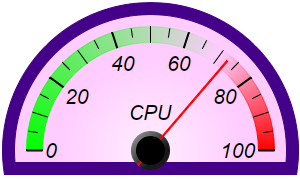
BaseMeter.addColorScale is used to create the color scales in this example. The color scales are created by with different colors, different end point positions and different widths at the end points.
Two pointer types are shown in these meters - a sharp very thin triangular pointer, and a line pointer. They are created using
AngularMeter.addPointer2 with
TriangularPointer2 and
LinePointer2 as parameters.
[Web Version (in ASP)] aspdemo\colorsemicirclemeter.asp
<%@ language="vbscript" %>
<%
Set cd = CreateObject("ChartDirector.API")

' This script can draw different charts depending on the chartIndex
Sub createChart(viewer, chartIndex)

    ' The value to display on the meter
    value = 72.55

    ' The background and border colors of the meters
    bgColor = Array(&H88ccff, &Hffdddd, &Hffddaa, &Hffccff, &Hdddddd, &Hccffcc)
    borderColor = Array(&H000077, &H880000, &Hee6600, &H440088, &H000000, &H006000)

    ' Create an AngularMeter object of size 300 x 180 pixels with transparent background
    Set m = cd.AngularMeter(300, 180, cd.Transparent)

    ' Center at (150, 150), scale radius = 124 pixels, scale angle -90 to +90 degrees
    Call m.setMeter(150, 150, 124, -90, 90)

    ' Background gradient color with brighter color at the center
    bgGradient = Array(0, m.adjustBrightness(bgColor(chartIndex), 3), 0.75, bgColor(chartIndex))

    ' Add a scale background of 148 pixels radius using the background gradient, with a 13 pixel
    ' thick border
    Call m.addScaleBackground(148, m.relativeRadialGradient(bgGradient), 13, borderColor( _
        chartIndex))

    ' Meter scale is 0 - 100, with major tick every 20 units, minor tick every 10 units, and micro
    ' tick every 5 units
    Call m.setScale(0, 100, 20, 10, 5)

    ' Set the scale label style to 15pt Arial Italic. Set the major/minor/micro tick lengths to
    ' 16/16/10 pixels pointing inwards, and their widths to 2/1/1 pixels.
    Call m.setLabelStyle("Arial Italic", 16)
    Call m.setTickLength(-16, -16, -10)
    Call m.setLineWidth(0, 2, 1, 1)

    ' Demostrate different types of color scales and putting them at different positions
    smoothColorScale = Array(0, &H3333ff, 25, &H0088ff, 50, &H00ff00, 75, &Hdddd00, 100, &Hff0000)
    stepColorScale = Array(0, &H00cc00, 60, &Hffdd00, 80, &Hee0000, 100)
    highLowColorScale = Array(0, &H00ff00, 70, cd.Transparent, 100, &Hff0000)

    If chartIndex = 0 Then
        ' Add the smooth color scale at the default position
        Call m.addColorScale(smoothColorScale)
    ElseIf chartIndex = 1 Then
        ' Add the smooth color scale starting at radius 124 with zero width and ending at radius 124
        ' with 16 pixels inner width
        Call m.addColorScale(smoothColorScale, 124, 0, 124, -16)
    ElseIf chartIndex = 2 Then
        ' Add the smooth color scale starting at radius 65 with zero width and ending at radius 55
        ' with 20 pixels outer width
        Call m.addColorScale(smoothColorScale, 65, 0, 55, 20)
    ElseIf chartIndex = 3 Then
        ' Add the high/low color scale at the default position
        Call m.addColorScale(highLowColorScale)
    ElseIf chartIndex = 4 Then
        ' Add the step color scale at the default position
        Call m.addColorScale(stepColorScale)
    Else
        ' Add the smooth color scale at radius 55 with 20 pixels outer width
        Call m.addColorScale(smoothColorScale, 55, 20)
    End If

    ' Add a text label centered at (150, 125) with 15pt Arial Italic font
    Call m.addText(150, 125, "CPU", "Arial Italic", 15, cd.TextColor, cd.BottomCenter)

    ' Demonstrate two different types of pointers - thin triangular pointer (the default) and line
    ' pointer
    If chartIndex Mod 2 = 0 Then
        Call m.addPointer2(value, &Hff0000)
    Else
        Call m.addPointer2(value, &Hff0000, -1, cd.LinePointer2)
    End If

    ' Output the chart
    Call viewer.setChart(m, cd.SVG)
End Sub

' This example includes 6 charts
Dim viewers(5)
For i = 0 To Ubound(viewers)
    Set viewers(i) = cd.WebChartViewer(Request, "chart" & i)
    Call createChart(viewers(i), i)
Next
%>

<!DOCTYPE html>
<html>
<head>
    <title>Color Semicircle Meters</title>
    <!-- Include ChartDirector Javascript Library to support chart interactions -->
    <script type="text/javascript" src="cdjcv.js"></script>
</head>
<body style="margin:5px 0px 0px 5px">
    <div style="font:bold 18pt verdana;">
        Color Semicircle Meters
    </div>
    <hr style="border:solid 1px #000080; background:#000080" />
    <div style="font:10pt verdana; margin-bottom:1.5em">
        <a href="viewsource.asp?file=<%= Request("SCRIPT_NAME") %>">View Chart Source Code</a>
    </div>
    <!-- ****** Here are the chart images ****** -->
    <%
        For i = 0 To Ubound(viewers)
            Call Response.Write(viewers(i).renderHTML())
            Call Response.Write(" ")
        Next
    %>
</body>
</html>
[Windows Version (in Visual Basic)] vbdemo\colorsemicirclemeter.cls
Public Sub createChart(viewer As Object, chartIndex As Integer)

    Dim cd As New ChartDirector.API

    ' The value to display on the meter
    Dim value As Double
    value = 72.55

    ' The background and border colors of the meters
    Dim bgColor()
    bgColor = Array(&H88ccff, &Hffdddd, &Hffddaa, &Hffccff, &Hdddddd, &Hccffcc)
    Dim borderColor()
    borderColor = Array(&H000077, &H880000, &Hee6600, &H440088, &H000000, &H006000)

    ' Create an AngularMeter object of size 300 x 180 pixels
    Dim m As AngularMeter
    Set m = cd.AngularMeter(300, 180)

    ' Center at (150, 150), scale radius = 124 pixels, scale angle -90 to +90 degrees
    Call m.setMeter(150, 150, 124, -90, 90)

    ' Background gradient color with brighter color at the center
    Dim bgGradient()
    bgGradient = Array(0, m.adjustBrightness(bgColor(chartIndex), 3), 0.75, bgColor(chartIndex))

    ' Add a scale background of 148 pixels radius using the background gradient, with a 13 pixel
    ' thick border
    Call m.addScaleBackground(148, m.relativeRadialGradient(bgGradient), 13, borderColor( _
        chartIndex))

    ' Meter scale is 0 - 100, with major tick every 20 units, minor tick every 10 units, and micro
    ' tick every 5 units
    Call m.setScale(0, 100, 20, 10, 5)

    ' Set the scale label style to 15pt Arial Italic. Set the major/minor/micro tick lengths to
    ' 16/16/10 pixels pointing inwards, and their widths to 2/1/1 pixels.
    Call m.setLabelStyle("ariali.ttf", 16)
    Call m.setTickLength(-16, -16, -10)
    Call m.setLineWidth(0, 2, 1, 1)

    ' Demostrate different types of color scales and putting them at different positions
    Dim smoothColorScale()
    smoothColorScale = Array(0, &H3333ff, 25, &H0088ff, 50, &H00ff00, 75, &Hdddd00, 100, &Hff0000)
    Dim stepColorScale()
    stepColorScale = Array(0, &H00cc00, 60, &Hffdd00, 80, &Hee0000, 100)
    Dim highLowColorScale()
    highLowColorScale = Array(0, &H00ff00, 70, cd.Transparent, 100, &Hff0000)

    If chartIndex = 0 Then
        ' Add the smooth color scale at the default position
        Call m.addColorScale(smoothColorScale)
    ElseIf chartIndex = 1 Then
        ' Add the smooth color scale starting at radius 124 with zero width and ending at radius 124
        ' with 16 pixels inner width
        Call m.addColorScale(smoothColorScale, 124, 0, 124, -16)
    ElseIf chartIndex = 2 Then
        ' Add the smooth color scale starting at radius 65 with zero width and ending at radius 55
        ' with 20 pixels outer width
        Call m.addColorScale(smoothColorScale, 65, 0, 55, 20)
    ElseIf chartIndex = 3 Then
        ' Add the high/low color scale at the default position
        Call m.addColorScale(highLowColorScale)
    ElseIf chartIndex = 4 Then
        ' Add the step color scale at the default position
        Call m.addColorScale(stepColorScale)
    Else
        ' Add the smooth color scale at radius 55 with 20 pixels outer width
        Call m.addColorScale(smoothColorScale, 55, 20)
    End If

    ' Add a text label centered at (150, 125) with 15pt Arial Italic font
    Call m.addText(150, 125, "CPU", "ariali.ttf", 15, cd.TextColor, cd.BottomCenter)

    ' Demonstrate two different types of pointers - thin triangular pointer (the default) and line
    ' pointer
    If chartIndex Mod 2 = 0 Then
        Call m.addPointer2(value, &Hff0000)
    Else
        Call m.addPointer2(value, &Hff0000, -1, cd.LinePointer2)
    End If

    ' Output the chart
    Set viewer.Picture = m.makePicture()

End Sub
© 2021 Advanced Software Engineering Limited. All rights reserved.