This example demonstrates spline and linear surface interpolation, and discrete and continuous coloring for the
ContourLayer.
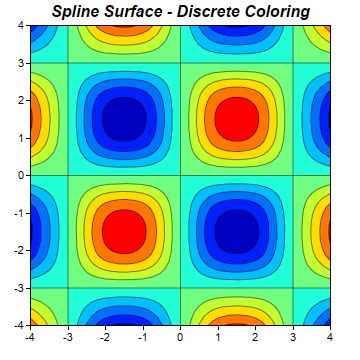
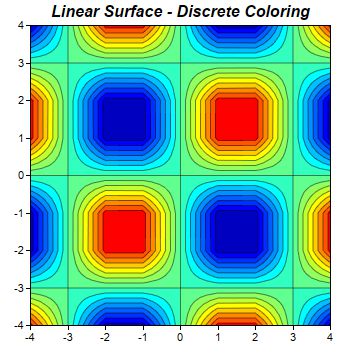
The input to the contour layer are the z values at certain (x, y) points. To draw the contour and to color the layer, it is necessarily to know the z values at all pixels in the xy plane. ChartDirector uses surface interpolation to compute the z values at all pixels from the given data points. Two types of interpolation - spline and linear - are supported. They can be configured using
ContourLayer.setSmoothInterpolation.
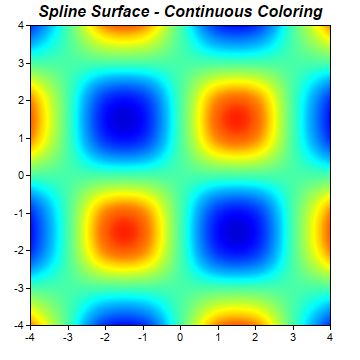
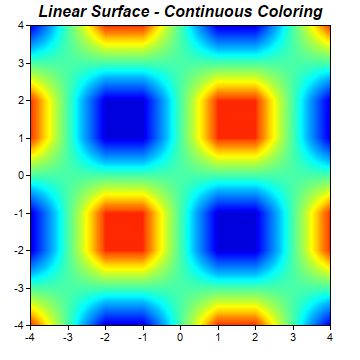
The coloring of the contour layer can be discrete or continuous, configurable using
ColorAxis.setColorGradient or
ColorAxis.setColorScale.
[Web Version (in ASP)] aspdemo\contourinterpolate.asp
<%@ language="vbscript" %>
<%
Set cd = CreateObject("ChartDirector.API")

' This script can draw different charts depending on the chartIndex
Sub createChart(viewer, chartIndex)

    ' The x and y coordinates of the grid
    dataX = Array(-4, -3, -2, -1, 0, 1, 2, 3, 4)
    dataY = Array(-4, -3, -2, -1, 0, 1, 2, 3, 4)

    ' The values at the grid points. In this example, we will compute the values using the formula z
    ' = Sin(x * pi / 3) * Sin(y * pi / 3).
    ReDim dataZ((UBound(dataX) + 1) * (UBound(dataY) + 1) - 1)
    For yIndex = 0 To UBound(dataY)
        y = dataY(yIndex)
        For xIndex = 0 To UBound(dataX)
            x = dataX(xIndex)
            dataZ(yIndex * (UBound(dataX) + 1) + xIndex) = Sin(x * 3.1416 / 3) * Sin(y * 3.1416 /3)
        Next
    Next

    ' Create a XYChart object of size 360 x 360 pixels
    Set c = cd.XYChart(360, 360)

    ' Set the plotarea at (30, 25) and of size 300 x 300 pixels. Use semi-transparent black
    ' (c0000000) for both horizontal and vertical grid lines
    Call c.setPlotArea(30, 25, 300, 300, -1, -1, -1, &Hc0000000, -1)

    ' Add a contour layer using the given data
    Set layer = c.addContourLayer(dataX, dataY, dataZ)

    ' Set the x-axis and y-axis scale
    Call c.xAxis().setLinearScale(-4, 4, 1)
    Call c.yAxis().setLinearScale(-4, 4, 1)

    If chartIndex = 0 Then
        ' Discrete coloring, spline surface interpolation
        Call c.addTitle("Spline Surface - Discrete Coloring", "Arial Bold Italic", 12)
    ElseIf chartIndex = 1 Then
        ' Discrete coloring, linear surface interpolation
        Call c.addTitle("Linear Surface - Discrete Coloring", "Arial Bold Italic", 12)
        Call layer.setSmoothInterpolation(False)
    ElseIf chartIndex = 2 Then
        ' Smooth coloring, spline surface interpolation
        Call c.addTitle("Spline Surface - Continuous Coloring", "Arial Bold Italic", 12)
        Call layer.setContourColor(cd.Transparent)
        Call layer.colorAxis().setColorGradient(True)
    Else
        ' Discrete coloring, linear surface interpolation
        Call c.addTitle("Linear Surface - Continuous Coloring", "Arial Bold Italic", 12)
        Call layer.setSmoothInterpolation(False)
        Call layer.setContourColor(cd.Transparent)
        Call layer.colorAxis().setColorGradient(True)
    End If

    ' Output the chart
    Call viewer.setChart(c, cd.SVG)
End Sub

' This example includes 4 charts
Dim viewers(3)
For i = 0 To Ubound(viewers)
    Set viewers(i) = cd.WebChartViewer(Request, "chart" & i)
    Call createChart(viewers(i), i)
Next
%>

<!DOCTYPE html>
<html>
<head>
    <title>Contour Interpolation</title>
    <!-- Include ChartDirector Javascript Library to support chart interactions -->
    <script type="text/javascript" src="cdjcv.js"></script>
</head>
<body style="margin:5px 0px 0px 5px">
    <div style="font:bold 18pt verdana;">
        Contour Interpolation
    </div>
    <hr style="border:solid 1px #000080; background:#000080" />
    <div style="font:10pt verdana; margin-bottom:1.5em">
        <a href="viewsource.asp?file=<%= Request("SCRIPT_NAME") %>">View Chart Source Code</a>
    </div>
    <!-- ****** Here are the chart images ****** -->
    <%
        For i = 0 To Ubound(viewers)
            Call Response.Write(viewers(i).renderHTML())
            Call Response.Write(" ")
        Next
    %>
</body>
</html>
[Windows Version (in Visual Basic)] vbdemo\contourinterpolate.cls
Public Sub createChart(viewer As Object, chartIndex As Integer)

    Dim cd As New ChartDirector.API

    ' The x and y coordinates of the grid
    Dim dataX()
    dataX = Array(-4, -3, -2, -1, 0, 1, 2, 3, 4)
    Dim dataY()
    dataY = Array(-4, -3, -2, -1, 0, 1, 2, 3, 4)

    ' The values at the grid points. In this example, we will compute the values using the formula z
    ' = Sin(x * pi / 3) * Sin(y * pi / 3).
    ReDim dataZ((UBound(dataX) + 1) * (UBound(dataY) + 1) - 1)
    Dim yIndex As Long
    For yIndex = 0 To UBound(dataY)
        Dim y As Double
        y = dataY(yIndex)
        Dim xIndex As Long
        For xIndex = 0 To UBound(dataX)
            Dim x As Double
            x = dataX(xIndex)
            dataZ(yIndex * (UBound(dataX) + 1) + xIndex) = Sin(x * 3.1416 / 3) * Sin(y * 3.1416 /3)
        Next
    Next

    ' Create a XYChart object of size 360 x 360 pixels
    Dim c As XYChart
    Set c = cd.XYChart(360, 360)

    ' Set the plotarea at (30, 25) and of size 300 x 300 pixels. Use semi-transparent black
    ' (c0000000) for both horizontal and vertical grid lines
    Call c.setPlotArea(30, 25, 300, 300, -1, -1, -1, &Hc0000000, -1)

    ' Add a contour layer using the given data
    Dim layer As ContourLayer
    Set layer = c.addContourLayer(dataX, dataY, dataZ)

    ' Set the x-axis and y-axis scale
    Call c.xAxis().setLinearScale(-4, 4, 1)
    Call c.yAxis().setLinearScale(-4, 4, 1)

    If chartIndex = 0 Then
        ' Discrete coloring, spline surface interpolation
        Call c.addTitle("Spline Surface - Discrete Coloring", "arialbi.ttf", 12)
    ElseIf chartIndex = 1 Then
        ' Discrete coloring, linear surface interpolation
        Call c.addTitle("Linear Surface - Discrete Coloring", "arialbi.ttf", 12)
        Call layer.setSmoothInterpolation(False)
    ElseIf chartIndex = 2 Then
        ' Smooth coloring, spline surface interpolation
        Call c.addTitle("Spline Surface - Continuous Coloring", "arialbi.ttf", 12)
        Call layer.setContourColor(cd.Transparent)
        Call layer.colorAxis().setColorGradient(True)
    Else
        ' Discrete coloring, linear surface interpolation
        Call c.addTitle("Linear Surface - Continuous Coloring", "arialbi.ttf", 12)
        Call layer.setSmoothInterpolation(False)
        Call layer.setContourColor(cd.Transparent)
        Call layer.colorAxis().setColorGradient(True)
    End If

    ' Output the chart
    Set viewer.Picture = c.makePicture()

End Sub
© 2021 Advanced Software Engineering Limited. All rights reserved.