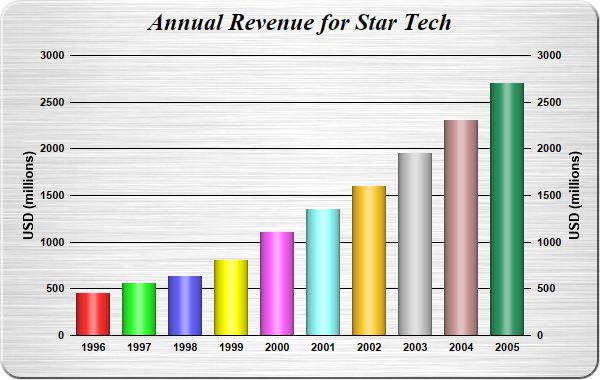
This example demonstrates using cylinder shading effect for bars. It also demonstrates brushed metal background, rounded frame, and axis labels on both sides of the plot area.
[Web Version (in ASP)] aspdemo\cylinderlightbar.asp
<%@ language="vbscript" %>
<%
Set cd = CreateObject("ChartDirector.API")

' The data for the bar chart
data = Array(450, 560, 630, 800, 1100, 1350, 1600, 1950, 2300, 2700)

' The labels for the bar chart
labels = Array("1996", "1997", "1998", "1999", "2000", "2001", "2002", "2003", "2004", "2005")

' Create a XYChart object of size 600 x 380 pixels. Set background color to brushed silver, with a 2
' pixel 3D border. Use rounded corners of 20 pixels radius.
Set c = cd.XYChart(600, 380, cd.brushedSilverColor(), cd.Transparent, 2)

' Add a title to the chart using 18pt Times Bold Italic font. Set top/bottom margins to 8 pixels.
Call c.addTitle("Annual Revenue for Star Tech", "Times New Roman Bold Italic", 18).setMargin2(0, _
    0, 8, 8)

' Set the plotarea at (70, 55) and of size 460 x 280 pixels. Use transparent border and black grid
' lines. Use rounded frame with radius of 20 pixels.
Call c.setPlotArea(70, 55, 460, 280, -1, -1, cd.Transparent, &H000000)
Call c.setRoundedFrame(&Hffffff, 20)

' Add a multi-color bar chart layer using the supplied data. Set cylinder bar shape.
Call c.addBarLayer3(data).setBarShape(cd.CircleShape)

' Set the labels on the x axis.
Call c.xAxis().setLabels(labels)

' Show the same scale on the left and right y-axes
Call c.syncYAxis()

' Set the left y-axis and right y-axis title using 10pt Arial Bold font
Call c.yAxis().setTitle("USD (millions)", "Arial Bold", 10)
Call c.yAxis2().setTitle("USD (millions)", "Arial Bold", 10)

' Set y-axes to transparent
Call c.yAxis().setColors(cd.Transparent)
Call c.yAxis2().setColors(cd.Transparent)

' Disable ticks on the x-axis by setting the tick color to transparent
Call c.xAxis().setTickColor(cd.Transparent)

' Set the label styles of all axes to 8pt Arial Bold font
Call c.xAxis().setLabelStyle("Arial Bold", 8)
Call c.yAxis().setLabelStyle("Arial Bold", 8)
Call c.yAxis2().setLabelStyle("Arial Bold", 8)

' Output the chart
Set viewer = cd.WebChartViewer(Request, "chart1")
Call viewer.setChart(c, cd.SVG)

' Include tool tip for the chart
viewer.ImageMap = c.getHTMLImageMap("", "", "title='Year {xLabel}: US$ {value}M'")
%>

<!DOCTYPE html>
<html>
<head>
    <title>Cylinder Bar Shading</title>
    <!-- Include ChartDirector Javascript Library to support chart interactions -->
    <script type="text/javascript" src="cdjcv.js"></script>
</head>
<body style="margin:5px 0px 0px 5px">
    <div style="font:bold 18pt verdana;">
        Cylinder Bar Shading
    </div>
    <hr style="border:solid 1px #000080; background:#000080" />
    <div style="font:10pt verdana; margin-bottom:1.5em">
        <a href="viewsource.asp?file=<%= Request("SCRIPT_NAME") %>">View Chart Source Code</a>
    </div>
    <!-- ****** Here is the chart image ****** -->
    <%= viewer.renderHTML() %>
</body>
</html>
[Windows Version (in Visual Basic)] vbdemo\cylinderlightbar.cls
Public Sub createChart(viewer As Object, chartIndex As Integer)

    Dim cd As New ChartDirector.API

    ' The data for the bar chart
    Dim data()
    data = Array(450, 560, 630, 800, 1100, 1350, 1600, 1950, 2300, 2700)

    ' The labels for the bar chart
    Dim labels()
    labels = Array("1996", "1997", "1998", "1999", "2000", "2001", "2002", "2003", "2004", "2005")

    ' Create a XYChart object of size 600 x 380 pixels. Set background color to brushed silver, with
    ' a 2 pixel 3D border. Use rounded corners of 20 pixels radius.
    Dim c As XYChart
    Set c = cd.XYChart(600, 380, cd.brushedSilverColor(), cd.Transparent, 2)

    ' Add a title to the chart using 18pt Times Bold Italic font. Set top/bottom margins to 8
    ' pixels.
    Call c.addTitle("Annual Revenue for Star Tech", "timesbi.ttf", 18).setMargin2(0, 0, 8, 8)

    ' Set the plotarea at (70, 55) and of size 460 x 280 pixels. Use transparent border and black
    ' grid lines. Use rounded frame with radius of 20 pixels.
    Call c.setPlotArea(70, 55, 460, 280, -1, -1, cd.Transparent, &H000000)
    Call c.setRoundedFrame(&Hffffff, 20)

    ' Add a multi-color bar chart layer using the supplied data. Set cylinder bar shape.
    Call c.addBarLayer3(data).setBarShape(cd.CircleShape)

    ' Set the labels on the x axis.
    Call c.xAxis().setLabels(labels)

    ' Show the same scale on the left and right y-axes
    Call c.syncYAxis()

    ' Set the left y-axis and right y-axis title using 10pt Arial Bold font
    Call c.yAxis().setTitle("USD (millions)", "arialbd.ttf", 10)
    Call c.yAxis2().setTitle("USD (millions)", "arialbd.ttf", 10)

    ' Set y-axes to transparent
    Call c.yAxis().setColors(cd.Transparent)
    Call c.yAxis2().setColors(cd.Transparent)

    ' Disable ticks on the x-axis by setting the tick color to transparent
    Call c.xAxis().setTickColor(cd.Transparent)

    ' Set the label styles of all axes to 8pt Arial Bold font
    Call c.xAxis().setLabelStyle("arialbd.ttf", 8)
    Call c.yAxis().setLabelStyle("arialbd.ttf", 8)
    Call c.yAxis2().setLabelStyle("arialbd.ttf", 8)

    ' Output the chart
    Set viewer.Picture = c.makePicture()

    'include tool tip for the chart
    viewer.ImageMap = c.getHTMLImageMap("clickable", "", "title='Year {xLabel}: US$ {value}M'")

End Sub
© 2021 Advanced Software Engineering Limited. All rights reserved.