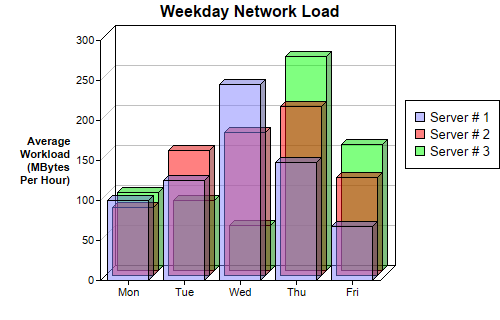
This example demonstrates using multiple bar layers with semi-transparent colors to create a depth bar chart.
ChartDirector allows an XYChart to containing multiple layers of the same or different types. In this example, all layers are 3D bar layers. The bars are drawn in semi-transparent colors to avoid the bars on the front hiding the bars at the back.
[Web Version (in ASP)] aspdemo\depthbar.asp
<%@ language="vbscript" %>
<%
Set cd = CreateObject("ChartDirector.API")

' The data for the bar chart
data0 = Array(100, 125, 245, 147, 67)
data1 = Array(85, 156, 179, 211, 123)
data2 = Array(97, 87, 56, 267, 157)

' The labels for the bar chart
labels = Array("Mon", "Tue", "Wed", "Thu", "Fri")

' Create a XYChart object of size 500 x 320 pixels
Set c = cd.XYChart(500, 320)

' Set the plotarea at (100, 40) and of size 280 x 240 pixels
Call c.setPlotArea(100, 40, 280, 240)

' Add a legend box at (405, 100)
Call c.addLegend(405, 100)

' Add a title to the chart
Call c.addTitle("Weekday Network Load")

' Add a title to the y axis. Draw the title upright (font angle = 0)
Call c.yAxis().setTitle("Average<*br*>Workload<*br*>(MBytes<*br*>Per Hour)").setFontAngle(0)

' Set the labels on the x axis
Call c.xAxis().setLabels(labels)

' Add three bar layers, each representing one data set. The bars are drawn in semi-transparent
' colors.
Call c.addBarLayer(data0, &H808080ff, "Server # 1", 5)
Call c.addBarLayer(data1, &H80ff0000, "Server # 2", 5)
Call c.addBarLayer(data2, &H8000ff00, "Server # 3", 5)

' Output the chart
Set viewer = cd.WebChartViewer(Request, "chart1")
Call viewer.setChart(c, cd.SVG)

' Include tool tip for the chart
viewer.ImageMap = c.getHTMLImageMap("", "", _
    "title='{dataSetName} on {xLabel}: {value} MBytes/hour'")
%>

<!DOCTYPE html>
<html>
<head>
    <title>Depth Bar Chart</title>
    <!-- Include ChartDirector Javascript Library to support chart interactions -->
    <script type="text/javascript" src="cdjcv.js"></script>
</head>
<body style="margin:5px 0px 0px 5px">
    <div style="font:bold 18pt verdana;">
        Depth Bar Chart
    </div>
    <hr style="border:solid 1px #000080; background:#000080" />
    <div style="font:10pt verdana; margin-bottom:1.5em">
        <a href="viewsource.asp?file=<%= Request("SCRIPT_NAME") %>">View Chart Source Code</a>
    </div>
    <!-- ****** Here is the chart image ****** -->
    <%= viewer.renderHTML() %>
</body>
</html>
[Windows Version (in Visual Basic)] vbdemo\depthbar.cls
Public Sub createChart(viewer As Object, chartIndex As Integer)

    Dim cd As New ChartDirector.API

    ' The data for the bar chart
    Dim data0()
    data0 = Array(100, 125, 245, 147, 67)
    Dim data1()
    data1 = Array(85, 156, 179, 211, 123)
    Dim data2()
    data2 = Array(97, 87, 56, 267, 157)

    ' The labels for the bar chart
    Dim labels()
    labels = Array("Mon", "Tue", "Wed", "Thu", "Fri")

    ' Create a XYChart object of size 500 x 320 pixels
    Dim c As XYChart
    Set c = cd.XYChart(500, 320)

    ' Set the plotarea at (100, 40) and of size 280 x 240 pixels
    Call c.setPlotArea(100, 40, 280, 240)

    ' Add a legend box at (405, 100)
    Call c.addLegend(405, 100)

    ' Add a title to the chart
    Call c.addTitle("Weekday Network Load")

    ' Add a title to the y axis. Draw the title upright (font angle = 0)
    Call c.yAxis().setTitle("Average<*br*>Workload<*br*>(MBytes<*br*>Per Hour)").setFontAngle(0)

    ' Set the labels on the x axis
    Call c.xAxis().setLabels(labels)

    ' Add three bar layers, each representing one data set. The bars are drawn in semi-transparent
    ' colors.
    Call c.addBarLayer(data0, &H808080ff, "Server # 1", 5)
    Call c.addBarLayer(data1, &H80ff0000, "Server # 2", 5)
    Call c.addBarLayer(data2, &H8000ff00, "Server # 3", 5)

    ' Output the chart
    Set viewer.Picture = c.makePicture()

    'include tool tip for the chart
    viewer.ImageMap = c.getHTMLImageMap("clickable", "", _
        "title='{dataSetName} on {xLabel}: {value} MBytes/hour'")

End Sub
© 2021 Advanced Software Engineering Limited. All rights reserved.