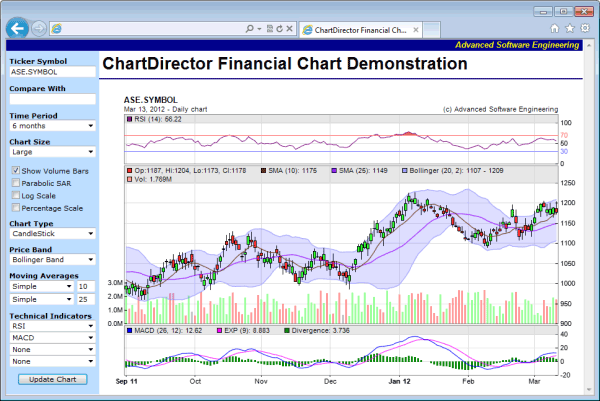
The Interactive Financial Chart is implemented in two parts - "financedemo.asp" for the containing web page, and "financedemochart.asp" for the charting page.
The containing web page "financedemo.asp" is basically just a standard HTML Form. When the "Update Chart" button is pressed, instead of posting to the server, a client side Javascript function is activated. This function combines all Form elements into a query string, appends it to the charting URL "financedemochart.asp" and uses it to update the <IMG> tag.
The "financedemochart.asp" draws the finance chart according to the query parameters, which reflects user selections, and outputs the chart to the <IMG> tag.
The "financedemochart.asp" contains two key parts.
- The get15MinData, getDailyData, getWeeklyData and getMonthlyData functions are for retrieving stock data. In this example, they just retrieve data from a random number generator. You may replace the code in these functions with your own code to get data from your data source.
- The drawChart function is the real charting code. It creates a FinanceChart object, sets data to it, and configures it according to query parameters.
[Web Version (in ASP)] aspdemo\financedemo.asp
<!DOCTYPE html>
<html>
<head>
<title>ChartDirector Financial Chart Demonstration</title>
<style>
.inputtitle {font:11px verdana; margin:10px 5px;}
.input {font:11px verdana}
</style>
<script language="Javascript">

//Update the chart according to user selection
function updateChart()
{
    //
    //we encode the values of all form elements as query parameters
    //
    var elements = document.getElementById("Form1").elements;
    var url = "financedemochart.asp";
    url += (url.indexOf('?') < 0) ? '?' : '&';
    for (var i = 0; i < elements.length; ++i)
    {
        var e = elements[i];
        if (e.type == "checkbox")
            url = url + e.id + "=" + (e.checked ? "1" : "0") + "&";
        else
            url = url + e.id + "=" + escape(e.value) + "&";
    }

    //Now we update the URL of the image to update the chart
    document.getElementById("ChartImage").src = url;
}

</script>
</head>
<body style="margin:0px" onLoad="updateChart();">
<table style="border:0px; padding:0px; border-spacing:0px;">
    <tr>
        <td align="right" colspan="2" style="background:#000088">
            <div style="padding:0px 3px 2px 0px; font:bold italic 10pt arial;">
                <a style="color:#ffff00; text-decoration:none" href="http://www.advsofteng.com">
                    Advanced Software Engineering
                </a>
            </div>
        </td>
    </tr>
    <tr valign="top">
        <td style="width:150px; background:#bbddff">
            <form id="Form1" action="javascript:updateChart()">
            <div class="inputtitle">
                <b>Ticker Symbol</b><br />
                <input id="TickerSymbol" name="TickerSymbol" class="input" style="width:140px;" value="ASE.SYMBOL">
            </div>
            <div class="inputtitle">
                <b>Compare With</b><br />
                <input id="CompareWith" name="CompareWith" class="input" style="width:140px;" value="">
            </div>
            <div class="inputtitle">
                <b>Time Period</b><br />
                <select id="TimeRange" name="TimeRange" class="input" style="width:140px;">
                    <option value="1">1 day</option>
                    <option value="2">2 days</option>
                    <option value="5">5 days</option>
                    <option value="10">10 days</option>
                    <option value="30">1 month</option>
                    <option value="60">2 months</option>
                    <option value="90">3 months</option>
                    <option value="180" selected>6 months</option>
                    <option value="360">1 year</option>
                    <option value="720">2 years</option>
                    <option value="1080">3 years</option>
                    <option value="1440">4 years</option>
                    <option value="1800">5 years</option>
                    <option value="3600">10 years</option>
                </select>
            </div>
            <div class="inputtitle">
                <b>Chart Size</b><br />
                <select id="ChartSize" name="ChartSize" class="input" style="width:140px;">
                    <option value="S">Small</option>
                    <option value="M">Medium</option>
                    <option value="L" selected>Large</option>
                    <option value="H">Huge</option>
                </select><br />
            </div>
            <div class="inputtitle">
                <input type="checkbox" id="Volume" name="Volume" checked><label for="Volume">Show Volume Bars</label><br />
                <input type="checkbox" id="ParabolicSAR" name="ParabolicSAR"><label for="ParabolicSAR">Parabolic SAR</label><br />
                <input type="checkbox" id="LogScale" name="LogScale"><label for="LogScale">Log Scale</label><br />
                <input type="checkbox" id="PercentageScale" name="PercentageScale"><label for="PercentageScale">Percentage Scale</label><br />
            </div>
            <div class="inputtitle">
                <b>Chart Type</b><br />
                <select id="ChartType" name="ChartType" class="input" style="width:140px;">
                    <option value="None">None</option>
                    <option value="CandleStick" selected>CandleStick</option>
                    <option value="Close">Closing Price</option>
                    <option value="Median">Median Price</option>
                    <option value="OHLC">OHLC</option>
                    <option value="TP">Typical Price</option>
                    <option value="WC">Weighted Close</option>
                </select>
            </div>
            <div class="inputtitle">
                <b>Price Band</b><br />
                <select id="Band" name="Band" class="input" style="width:140px;">
                    <option value="None">None</option>
                    <option value="BB" selected>Bollinger Band</option>
                    <option value="DC">Donchian Channel</option>
                    <option value="Envelop">Envelop (SMA 20 +/- 10%)</option>
                </select>
            </div>
            <div class="inputtitle">
                <b>Moving Averages</b><br />
                <nobr><select id="avgType1" name="avgType1" class="input" style="width:105px;">
                    <option value="None">None</option>
                    <option value="SMA" selected>Simple</option>
                    <option value="EMA">Exponential</option>
                    <option value="TMA">Triangular</option>
                    <option value="WMA">Weighted</option>
                </select>
                <input id="movAvg1" name="movAvg1" class="input" style="width:30px;" value="10"></nobr><br />
                <nobr><select id="avgType2" name="avgType2" class="input" style="width:105px;">
                    <option value="None">None</option>
                    <option value="SMA" selected>Simple</option>
                    <option value="EMA">Exponential</option>
                    <option value="TMA">Triangular</option>
                    <option value="WMA">Weighted</option>
                </select>
                <input id="movAvg2" name="movAvg2" class="input" style="width:30px;" value="25"></nobr><br />
            </div>
            <div class="inputtitle">
                <b>Technical Indicators</b><br />
                <select id="Indicator1" name="Indicator1" class="input" style="width:140px;">
                    <option value="None">None</option>
                    <option value="AccDist">Accumulation/Distribution</option>
                    <option value="AroonOsc">Aroon Oscillator</option>
                    <option value="Aroon">Aroon Up/Down</option>
                    <option value="ADX">Avg Directional Index</option>
                    <option value="ATR">Avg True Range</option>
                    <option value="BBW">Bollinger Band Width</option>
                    <option value="CMF">Chaikin Money Flow</option>
                    <option value="COscillator">Chaikin Oscillator</option>
                    <option value="CVolatility">Chaikin Volatility</option>
                    <option value="CLV">Close Location Value</option>
                    <option value="CCI">Commodity Channel Index</option>
                    <option value="DPO">Detrended Price Osc</option>
                    <option value="DCW">Donchian Channel Width</option>
                    <option value="EMV">Ease of Movement</option>
                    <option value="FStoch">Fast Stochastic</option>
                    <option value="MACD">MACD</option>
                    <option value="MDX">Mass Index</option>
                    <option value="Momentum">Momentum</option>
                    <option value="MFI">Money Flow Index</option>
                    <option value="NVI">Neg Volume Index</option>
                    <option value="OBV">On Balance Volume</option>
                    <option value="Performance">Performance</option>
                    <option value="PPO">% Price Oscillator</option>
                    <option value="PVO">% Volume Oscillator</option>
                    <option value="PVI">Pos Volume Index</option>
                    <option value="PVT">Price Volume Trend</option>
                    <option value="ROC">Rate of Change</option>
                    <option value="RSI" selected>RSI</option>
                    <option value="SStoch">Slow Stochastic</option>
                    <option value="StochRSI">StochRSI</option>
                    <option value="TRIX">TRIX</option>
                    <option value="UO">Ultimate Oscillator</option>
                    <option value="Vol">Volume</option>
                    <option value="WilliamR">William's %R</option>
                </select><br />
                <select id="Indicator2" name="Indicator2" class="input" style="width:140px;">
                    <option value="None">None</option>
                    <option value="AccDist">Accumulation/Distribution</option>
                    <option value="AroonOsc">Aroon Oscillator</option>
                    <option value="Aroon">Aroon Up/Down</option>
                    <option value="ADX">Avg Directional Index</option>
                    <option value="ATR">Avg True Range</option>
                    <option value="BBW">Bollinger Band Width</option>
                    <option value="CMF">Chaikin Money Flow</option>
                    <option value="COscillator">Chaikin Oscillator</option>
                    <option value="CVolatility">Chaikin Volatility</option>
                    <option value="CLV">Close Location Value</option>
                    <option value="CCI">Commodity Channel Index</option>
                    <option value="DPO">Detrended Price Osc</option>
                    <option value="DCW">Donchian Channel Width</option>
                    <option value="EMV">Ease of Movement</option>
                    <option value="FStoch">Fast Stochastic</option>
                    <option value="MACD" selected>MACD</option>
                    <option value="MDX">Mass Index</option>
                    <option value="Momentum">Momentum</option>
                    <option value="MFI">Money Flow Index</option>
                    <option value="NVI">Neg Volume Index</option>
                    <option value="OBV">On Balance Volume</option>
                    <option value="Performance">Performance</option>
                    <option value="PPO">% Price Oscillator</option>
                    <option value="PVO">% Volume Oscillator</option>
                    <option value="PVI">Pos Volume Index</option>
                    <option value="PVT">Price Volume Trend</option>
                    <option value="ROC">Rate of Change</option>
                    <option value="RSI">RSI</option>
                    <option value="SStoch">Slow Stochastic</option>
                    <option value="StochRSI">StochRSI</option>
                    <option value="TRIX">TRIX</option>
                    <option value="UO">Ultimate Oscillator</option>
                    <option value="Vol">Volume</option>
                    <option value="WilliamR">William's %R</option>
                </select><br />
                <select id="Indicator3" name="Indicator3" class="input" style="width:140px;">
                    <option value="None" selected>None</option>
                    <option value="AccDist">Accumulation/Distribution</option>
                    <option value="AroonOsc">Aroon Oscillator</option>
                    <option value="Aroon">Aroon Up/Down</option>
                    <option value="ADX">Avg Directional Index</option>
                    <option value="ATR">Avg True Range</option>
                    <option value="BBW">Bollinger Band Width</option>
                    <option value="CMF">Chaikin Money Flow</option>
                    <option value="COscillator">Chaikin Oscillator</option>
                    <option value="CVolatility">Chaikin Volatility</option>
                    <option value="CLV">Close Location Value</option>
                    <option value="CCI">Commodity Channel Index</option>
                    <option value="DPO">Detrended Price Osc</option>
                    <option value="DCW">Donchian Channel Width</option>
                    <option value="EMV">Ease of Movement</option>
                    <option value="FStoch">Fast Stochastic</option>
                    <option value="MACD">MACD</option>
                    <option value="MDX">Mass Index</option>
                    <option value="Momentum">Momentum</option>
                    <option value="MFI">Money Flow Index</option>
                    <option value="NVI">Neg Volume Index</option>
                    <option value="OBV">On Balance Volume</option>
                    <option value="Performance">Performance</option>
                    <option value="PPO">% Price Oscillator</option>
                    <option value="PVO">% Volume Oscillator</option>
                    <option value="PVI">Pos Volume Index</option>
                    <option value="PVT">Price Volume Trend</option>
                    <option value="ROC">Rate of Change</option>
                    <option value="RSI">RSI</option>
                    <option value="SStoch">Slow Stochastic</option>
                    <option value="StochRSI">StochRSI</option>
                    <option value="TRIX">TRIX</option>
                    <option value="UO">Ultimate Oscillator</option>
                    <option value="Vol">Volume</option>
                    <option value="WilliamR">William's %R</option>
                </select><br />
                <select id="Indicator4" name="Indicator4" class="input" style="width:140px;">
                    <option value="None" selected>None</option>
                    <option value="AccDist">Accumulation/Distribution</option>
                    <option value="AroonOsc">Aroon Oscillator</option>
                    <option value="Aroon">Aroon Up/Down</option>
                    <option value="ADX">Avg Directional Index</option>
                    <option value="ATR">Avg True Range</option>
                    <option value="BBW">Bollinger Band Width</option>
                    <option value="CMF">Chaikin Money Flow</option>
                    <option value="COscillator">Chaikin Oscillator</option>
                    <option value="CVolatility">Chaikin Volatility</option>
                    <option value="CLV">Close Location Value</option>
                    <option value="CCI">Commodity Channel Index</option>
                    <option value="DPO">Detrended Price Osc</option>
                    <option value="DCW">Donchian Channel Width</option>
                    <option value="EMV">Ease of Movement</option>
                    <option value="FStoch">Fast Stochastic</option>
                    <option value="MACD">MACD</option>
                    <option value="MDX">Mass Index</option>
                    <option value="Momentum">Momentum</option>
                    <option value="MFI">Money Flow Index</option>
                    <option value="NVI">Neg Volume Index</option>
                    <option value="OBV">On Balance Volume</option>
                    <option value="Performance">Performance</option>
                    <option value="PPO">% Price Oscillator</option>
                    <option value="PVO">% Volume Oscillator</option>
                    <option value="PVI">Pos Volume Index</option>
                    <option value="PVT">Price Volume Trend</option>
                    <option value="ROC">Rate of Change</option>
                    <option value="RSI">RSI</option>
                    <option value="SStoch">Slow Stochastic</option>
                    <option value="StochRSI">StochRSI</option>
                    <option value="TRIX">TRIX</option>
                    <option value="UO">Ultimate Oscillator</option>
                    <option value="Vol">Volume</option>
                    <option value="WilliamR">William's %R</option>
                </select>
            </div>
            <div class="inputtitle" style="text-align:center">
                <input id="Button1" name="Button1" type="submit" class="input" value="Update Chart">
            </div>
            </form>
        </td>
        <td>
            <div style="font:bold 20pt arial; margin:5px 0px 0px 5px">
                ChartDirector Financial Chart Demonstration
            </div>
            <hr style="border:solid 1px #000080" />
            <br />
            <img id="ChartImage" align="top" border="0">
        </td>
    </tr>
</table>
</body>
</html>
[Web Version (in ASP)] aspdemo\financedemochart.asp
<%@ language="vbscript" %>
<%
Set cd = CreateObject("ChartDirector.API")

'
' Create a finance chart based on user selections, which are encoded as query parameters. This code
' is designed to work with the financedemo HTML form.
'

' The timeStamps, volume, high, low, open and close data
timeStamps = Array()
volData = Array()
highData = Array()
lowData = Array()
openData = Array()
closeData = Array()

' An extra data series to compare with the close data
compareData = Array()

' The resolution of the data in seconds. 1 day = 86400 seconds.
resolution = 86400

'/ <summary>
'/ Get the timeStamps, highData, lowData, openData, closeData and volData.
'/ </summary>
'/ <param name="ticker">The ticker symbol for the data series.</param>
'/ <param name="startDate">The starting date/time for the data series.</param>
'/ <param name="endDate">The ending date/time for the data series.</param>
'/ <param name="durationInDays">The number of trading days to get.</param>
'/ <param name="extraPoints">The extra leading data points needed in order to
'/ compute moving averages.</param>
'/ <returns>True if successfully obtain the data, otherwise false.</returns>
Function getData(ticker, startDate, endDate, durationInDays, extraPoints)
    ' This method should return false if the ticker symbol is invalid. In this sample code, as we
    ' are using a random number generator for the data, all ticker symbol is allowed, but we still
    ' assumed an empty symbol is invalid.
    If ticker = "" Then
        getData = False
        Exit Function
    End If

    ' In this demo, we can get 15 min, daily, weekly or monthly data depending on the time range.
    resolution = 86400
    If durationInDays <= 10 Then
        ' 10 days or less, we assume 15 minute data points are available
        resolution = 900

        ' We need to adjust the startDate backwards for the extraPoints. We assume 6.5 hours trading
        ' time per day, and 5 trading days per week.
        dataPointsPerDay = 6.5 * 3600 / resolution
        adjustedStartDate = DateSerial(Year(startDate), Month(startDate), Day(startDate) - _
            Int(extraPoints / dataPointsPerDay * 7 / 5 + 0.9999999) - 2)

        ' Get the required 15 min data
        Call get15MinData(ticker, adjustedStartDate, endDate)

    ElseIf durationInDays >= 4.5 * 360 Then
        ' 4 years or more - use monthly data points.
        resolution = 30 * 86400

        ' Adjust startDate backwards to cater for extraPoints
        adjustedStartDate = DateAdd("m", -extraPoints, startDate)

        ' Get the required monthly data
        Call getMonthlyData(ticker, adjustedStartDate, endDate)

    ElseIf durationInDays >= 1.5 * 360 Then
        ' 1 year or more - use weekly points.
        resolution = 7 * 86400

        ' Adjust startDate backwards to cater for extraPoints
        adjustedStartDate = DateAdd("d", -extraPoints * 7 - 6, startDate)

        ' Get the required weekly data
        Call getWeeklyData(ticker, adjustedStartDate, endDate)

    Else
        ' Default - use daily points
        resolution = 86400

        ' Adjust startDate backwards to cater for extraPoints. We multiply the days by 7/5 as we
        ' assume 1 week has 5 trading days.
        adjustedStartDate = DateSerial(Year(startDate), Month(startDate), Day(startDate) - _
            Int((extraPoints * 7 + 4) / 5) - 2)

        ' Get the required daily data
        Call getDailyData(ticker, adjustedStartDate, endDate)
    End If

    getData = True
    Exit Function
End Function

'/ <summary>
'/ Get 15 minutes data series for timeStamps, highData, lowData, openData, closeData
'/ and volData.
'/ </summary>
'/ <param name="ticker">The ticker symbol for the data series.</param>
'/ <param name="startDate">The starting date/time for the data series.</param>
'/ <param name="endDate">The ending date/time for the data series.</param>
Sub get15MinData(ticker, startDate, endDate)
    '
    ' In this demo, we use a random number generator to generate the data. In practice, you may get
    ' the data from a database or by other means. If you do not have 15 minute data, you may modify
    ' the "drawChart" method below to not using 15 minute data.
    '
    Call generateRandomData(ticker, startDate, endDate, 900)
End Sub

'/ <summary>
'/ Get daily data series for timeStamps, highData, lowData, openData, closeData
'/ and volData.
'/ </summary>
'/ <param name="ticker">The ticker symbol for the data series.</param>
'/ <param name="startDate">The starting date/time for the data series.</param>
'/ <param name="endDate">The ending date/time for the data series.</param>
Sub getDailyData(ticker, startDate, endDate)
    '
    ' In this demo, we use a random number generator to generate the data. In practice, you may get
    ' the data from a database or by other means.
    '
    Call generateRandomData(ticker, startDate, endDate, 86400)
End Sub

'/ <summary>
'/ Get weekly data series for timeStamps, highData, lowData, openData, closeData
'/ and volData.
'/ </summary>
'/ <param name="ticker">The ticker symbol for the data series.</param>
'/ <param name="startDate">The starting date/time for the data series.</param>
'/ <param name="endDate">The ending date/time for the data series.</param>
Sub getWeeklyData(ticker, startDate, endDate)
    '
    ' If you do not have weekly data, you may call "getDailyData(startDate, endDate)" to get daily
    ' data, then call "convertDailyToWeeklyData()" to convert to weekly data.
    '
    Call generateRandomData(ticker, startDate, endDate, 86400 * 7)
End Sub

'/ <summary>
'/ Get monthly data series for timeStamps, highData, lowData, openData, closeData
'/ and volData.
'/ </summary>
'/ <param name="ticker">The ticker symbol for the data series.</param>
'/ <param name="startDate">The starting date/time for the data series.</param>
'/ <param name="endDate">The ending date/time for the data series.</param>
Sub getMonthlyData(ticker, startDate, endDate)
    '
    ' If you do not have weekly data, you may call "getDailyData(startDate, endDate)" to get daily
    ' data, then call "convertDailyToMonthlyData()" to convert to monthly data.
    '
    Call generateRandomData(ticker, startDate, endDate, 86400 * 30)
End Sub

'/ <summary>
'/ A random number generator designed to generate realistic financial data.
'/ </summary>
'/ <param name="ticker">The ticker symbol for the data series.</param>
'/ <param name="startDate">The starting date/time for the data series.</param>
'/ <param name="endDate">The ending date/time for the data series.</param>
'/ <param name="resolution">The period of the data series.</param>
Sub generateRandomData(ticker, startDate, endDate, resolution)
    Set db = cd.FinanceSimulator(ticker, startDate, endDate, resolution)
    timeStamps = cd.NTime(db.getTimeStamps())
    highData = db.getHighData()
    lowData = db.getLowData()
    openData = db.getOpenData()
    closeData = db.getCloseData()
    volData = db.getVolData()
End Sub

'/ <summary>
'/ A utility to convert daily to weekly data.
'/ </summary>
Sub convertDailyToWeeklyData()
    Call aggregateData(cd.ArrayMath(timeStamps).selectStartOfWeek())
End Sub

'/ <summary>
'/ A utility to convert daily to monthly data.
'/ </summary>
Sub convertDailyToMonthlyData()
    Call aggregateData(cd.ArrayMath(timeStamps).selectStartOfMonth())
End Sub

'/ <summary>
'/ An internal method used to aggregate daily data.
'/ </summary>
Sub aggregateData(aggregator)
    timeStamps = aggregator.aggregate(timeStamps, cd.AggregateFirst)
    highData = aggregator.aggregate(highData, cd.AggregateMax)
    lowData = aggregator.aggregate(lowData, cd.AggregateMin)
    openData = aggregator.aggregate(openData, cd.AggregateFirst)
    closeData = aggregator.aggregate(closeData, cd.AggregateLast)
    volData = aggregator.aggregate(volData, cd.AggregateSum)
End Sub

'/ <summary>
'/ Create a financial chart according to user selections. The user selections are
'/ encoded in the query parameters.
'/ </summary>
Function drawChart()
    ' In this demo, we just assume we plot up to the latest time. So end date is now.
    endDate = Now

    ' If the trading day has not yet started (before 9:30am), or if the end date is on on Sat or
    ' Sun, we set the end date to 4:00pm of the last trading day
    Do While Hour(endDate) * 60 + Minute(endDate) < 9 * 60 + 30 Or _
        WeekDay(endDate) = vbSunday Or WeekDay(endDate) = vbSaturday
        endDate = DateSerial(Year(endDate), Month(endDate), Day(endDate) - 1) + _
            TimeSerial(16, 0, 0)
    Loop

    ' The duration selected by the user
    durationInDays = CInt(Request("TimeRange"))

    ' Compute the start date by subtracting the duration from the end date.
    startDate = endDate
    If durationInDays >= 30 Then
        ' More or equal to 30 days - so we use months as the unit
        startDate = DateSerial(Year(endDate), Month(endDate) - durationInDays / 30, 1)
    Else
        ' Less than 30 days - use day as the unit. The starting point of the axis is always at the
        ' start of the day (9:30am). Note that we use trading days, so we skip Sat and Sun in
        ' counting the days.
        startDate = DateSerial(Year(endDate), Month(endDate), Day(endDate)) + _
            TimeSerial(9, 30, 0)
        For i = 1 To durationInDays - 1
            If WeekDay(startDate) = vbMonday Then
                startDate = DateAdd("d", -3, startDate)
            Else
                startDate = DateAdd("d", -1, startDate)
            End If
        Next
    End If

    ' The moving average periods selected by the user.
    avgPeriod1 = 0
    If isNumeric(Request("movAvg1")) Then
        avgPeriod1 = CInt(Request("movAvg1"))
    Else
        avgPeriod1 = 0
    End If
    avgPeriod2 = 0
    If isNumeric(Request("movAvg2")) Then
        avgPeriod2 = CInt(Request("movAvg2"))
    Else
        avgPeriod2 = 0
    End If

    If avgPeriod1 < 0 Then
        avgPeriod1 = 0
    ElseIf avgPeriod1 > 300 Then
        avgPeriod1 = 300
    End If

    If avgPeriod2 < 0 Then
        avgPeriod2 = 0
    ElseIf avgPeriod2 > 300 Then
        avgPeriod2 = 300
    End If

    ' We need extra leading data points in order to compute moving averages.
    extraPoints = 20
    If avgPeriod1 > extraPoints Then
        extraPoints = avgPeriod1
    End If
    If avgPeriod2 > extraPoints Then
        extraPoints = avgPeriod2
    End If

    ' Get the data series to compare with, if any.
    compareKey = Trim(Request("CompareWith"))
    compareData = Array()
    If getData(compareKey, startDate, endDate, durationInDays, extraPoints) Then
          compareData = closeData
    End If

    ' The data series we want to get.
    tickerKey = Trim(Request("TickerSymbol"))
    If Not getData(tickerKey, startDate, endDate, durationInDays, extraPoints) Then
        Set drawChart = errMsg("Please enter a valid ticker symbol")
        Exit Function
    End If

    ' We now confirm the actual number of extra points (data points that are before the start date)
    ' as inferred using actual data from the database.
    extraPoints = UBound(timeStamps) + 1
    For i = 0 To UBound(timeStamps)
        If timeStamps(i) >= startDate Then
            extraPoints = i
            Exit For
        End If
    Next

    ' Check if there is any valid data
    If extraPoints >= UBound(timeStamps) + 1 Then
        ' No data - just display the no data message.
        Set drawChart = errMsg("No data available for the specified time period")
        Exit Function
    End If

    ' In some finance chart presentation style, even if the data for the latest day is not fully
    ' available, the axis for the entire day will still be drawn, where no data will appear near the
    ' end of the axis.
    If resolution < 86400 Then
        ' Add extra points to the axis until it reaches the end of the day. The end of day is
        ' assumed to be 16:00 (it depends on the stock exchange).
        lastTime = timeStamps(UBound(timeStamps))
        extraTrailingPoints = Int((16 * 3600.0 - Hour(lastTime) * 3600 - Minute(lastTime) * 60 - _
            Second(lastTime)) / resolution)
        If extraTrailingPoints > 0 Then
            originalSize = UBound(timeStamps) + 1
            ReDim Preserve timeStamps(originalSize + extraTrailingPoints - 1)
            For i = 0 To extraTrailingPoints - 1
                timeStamps(originalSize + i) = DateAdd("s", resolution * (i + 1), lastTime)
            Next
        End If
    End If

    '
    ' At this stage, all data are available. We can draw the chart as according to user input.
    '

    '
    ' Determine the chart size. In this demo, user can select 4 different chart sizes. Default is
    ' the large chart size.
    '
    width = 780
    mainHeight = 255
    indicatorHeight = 80

    size = Request("ChartSize")
    If size = "S" Then
        ' Small chart size
        width = 450
        mainHeight = 160
        indicatorHeight = 60
    ElseIf size = "M" Then
        ' Medium chart size
        width = 620
        mainHeight = 215
        indicatorHeight = 70
    ElseIf size = "H" Then
        ' Huge chart size
        width = 1000
        mainHeight = 320
        indicatorHeight = 90
    End If

    ' Create the chart object using the selected size
    Set m = cd.FinanceChart(width)

    ' Set the data into the chart object
    Call m.setData(timeStamps, highData, lowData, openData, closeData, volData, extraPoints)

    '
    ' We configure the title of the chart. In this demo chart design, we put the company name as the
    ' top line of the title with left alignment.
    '
    Call m.addPlotAreaTitle(cd.TopLeft, tickerKey)

    ' We displays the current date as well as the data resolution on the next line.
    resolutionText = ""
    If resolution = 30 * 86400 Then
        resolutionText = "Monthly"
    ElseIf resolution = 7 * 86400 Then
        resolutionText = "Weekly"
    ElseIf resolution = 86400 Then
        resolutionText = "Daily"
    ElseIf resolution = 900 Then
        resolutionText = "15-min"
    End If

    Call m.addPlotAreaTitle(cd.BottomLeft, "<*font=Arial,size=8*>" & m.formatValue(Now, _
        "mmm dd, yyyy") & " - " & resolutionText & " chart")

    ' A copyright message at the bottom left corner the title area
    Call m.addPlotAreaTitle(cd.BottomRight, _
        "<*font=Arial,size=8*>(c) Advanced Software Engineering")

    '
    ' Add the first techical indicator according. In this demo, we draw the first indicator on top
    ' of the main chart.
    '
    Call addIndicator(m, Request("Indicator1"), indicatorHeight)

    '
    ' Add the main chart
    '
    Call m.addMainChart(mainHeight)

    '
    ' Set log or linear scale according to user preference
    '
    If Request("LogScale") = "1" Then
        Call m.setLogScale(True)
    End If

    '
    ' Set axis labels to show data values or percentage change to user preference
    '
    If Request("PercentageScale") = "1" Then
        Call m.setPercentageAxis()
    End If

    '
    ' Draw any price line the user has selected
    '
    mainType = Request("ChartType")
    If mainType = "Close" Then
        Call m.addCloseLine(&H000040)
    ElseIf mainType = "TP" Then
        Call m.addTypicalPrice(&H000040)
    ElseIf mainType = "WC" Then
        Call m.addWeightedClose(&H000040)
    ElseIf mainType = "Median" Then
        Call m.addMedianPrice(&H000040)
    End If

    '
    ' Add comparison line if there is data for comparison
    '
    If UBound(compareData) >= 0 Then
        If UBound(compareData) + 1 > extraPoints Then
            Call m.addComparison(compareData, &H0000ff, compareKey)
        End If
    End If

    '
    ' Add moving average lines.
    '
    Call addMovingAvg(m, Request("avgType1"), avgPeriod1, &H663300)
    Call addMovingAvg(m, Request("avgType2"), avgPeriod2, &H9900ff)

    '
    ' Draw candlesticks or OHLC symbols if the user has selected them.
    '
    If mainType = "CandleStick" Then
        Call m.addCandleStick(&H33ff33, &Hff3333)
    ElseIf mainType = "OHLC" Then
        Call m.addHLOC(&H008800, &Hcc0000)
    End If

    '
    ' Add parabolic SAR if necessary
    '
    If Request("ParabolicSAR") = "1" Then
        Call m.addParabolicSAR(0.02, 0.02, 0.2, cd.DiamondShape, 5, &H008800, &H000000)
    End If

    '
    ' Add price band/channel/envelop to the chart according to user selection
    '
    bandType = Request("Band")
    If bandType = "BB" Then
        Call m.addBollingerBand(20, 2, &H9999ff, &Hc06666ff)
    ElseIf bandType = "DC" Then
        Call m.addDonchianChannel(20, &H9999ff, &Hc06666ff)
    ElseIf bandType = "Envelop" Then
        Call m.addEnvelop(20, 0.1, &H9999ff, &Hc06666ff)
    End If

    '
    ' Add volume bars to the main chart if necessary
    '
    If Request("Volume") = "1" Then
        Call m.addVolBars(indicatorHeight, &H99ff99, &Hff9999, &Hc0c0c0)
    End If

    '
    ' Add additional indicators as according to user selection.
    '
    Call addIndicator(m, Request("Indicator2"), indicatorHeight)
    Call addIndicator(m, Request("Indicator3"), indicatorHeight)
    Call addIndicator(m, Request("Indicator4"), indicatorHeight)

    Set drawChart = m
    Exit Function
End Function

'/ <summary>
'/ Add a moving average line to the FinanceChart object.
'/ </summary>
'/ <param name="m">The FinanceChart object to add the line to.</param>
'/ <param name="avgType">The moving average type (SMA/EMA/TMA/WMA).</param>
'/ <param name="avgPeriod">The moving average period.</param>
'/ <param name="color">The color of the line.</param>
'/ <returns>The LineLayer object representing line layer created.</returns>
Function addMovingAvg(m, avgType, avgPeriod, color)
    If avgPeriod > 1 Then
        If avgType = "SMA" Then
            Set addMovingAvg = m.addSimpleMovingAvg(avgPeriod, color)
            Exit Function
        ElseIf avgType = "EMA" Then
            Set addMovingAvg = m.addExpMovingAvg(avgPeriod, color)
            Exit Function
        ElseIf avgType = "TMA" Then
            Set addMovingAvg = m.addTriMovingAvg(avgPeriod, color)
            Exit Function
        ElseIf avgType = "WMA" Then
            Set addMovingAvg = m.addWeightedMovingAvg(avgPeriod, color)
            Exit Function
        End If
    End If
    Set addMovingAvg = Nothing
    Exit Function
End Function

'/ <summary>
'/ Add an indicator chart to the FinanceChart object. In this demo example, the
'/ indicator parameters (such as the period used to compute RSI, colors of the lines,
'/ etc.) are hard coded to commonly used values. You are welcome to design a more
'/ complex user interface to allow users to set the parameters.
'/ </summary>
'/ <param name="m">The FinanceChart object to add the line to.</param>
'/ <param name="indicator">The selected indicator.</param>
'/ <param name="height">Height of the chart in pixels</param>
'/ <returns>The XYChart object representing indicator chart.</returns>
Function addIndicator(m, indicator, height)
    If indicator = "RSI" Then
        Set addIndicator = m.addRSI(height, 14, &H800080, 20, &Hff6666, &H6666ff)
        Exit Function
    ElseIf indicator = "StochRSI" Then
        Set addIndicator = m.addStochRSI(height, 14, &H800080, 30, &Hff6666, &H6666ff)
        Exit Function
    ElseIf indicator = "MACD" Then
        Set addIndicator = m.addMACD(height, 26, 12, 9, &H0000ff, &Hff00ff, &H008000)
        Exit Function
    ElseIf indicator = "FStoch" Then
        Set addIndicator = m.addFastStochastic(height, 14, 3, &H006060, &H606000)
        Exit Function
    ElseIf indicator = "SStoch" Then
        Set addIndicator = m.addSlowStochastic(height, 14, 3, &H006060, &H606000)
        Exit Function
    ElseIf indicator = "ATR" Then
        Set addIndicator = m.addATR(height, 14, &H808080, &H0000ff)
        Exit Function
    ElseIf indicator = "ADX" Then
        Set addIndicator = m.addADX(height, 14, &H008000, &H800000, &H000080)
        Exit Function
    ElseIf indicator = "DCW" Then
        Set addIndicator = m.addDonchianWidth(height, 20, &H0000ff)
        Exit Function
    ElseIf indicator = "BBW" Then
        Set addIndicator = m.addBollingerWidth(height, 20, 2, &H0000ff)
        Exit Function
    ElseIf indicator = "DPO" Then
        Set addIndicator = m.addDPO(height, 20, &H0000ff)
        Exit Function
    ElseIf indicator = "PVT" Then
        Set addIndicator = m.addPVT(height, &H0000ff)
        Exit Function
    ElseIf indicator = "Momentum" Then
        Set addIndicator = m.addMomentum(height, 12, &H0000ff)
        Exit Function
    ElseIf indicator = "Performance" Then
        Set addIndicator = m.addPerformance(height, &H0000ff)
        Exit Function
    ElseIf indicator = "ROC" Then
        Set addIndicator = m.addROC(height, 12, &H0000ff)
        Exit Function
    ElseIf indicator = "OBV" Then
        Set addIndicator = m.addOBV(height, &H0000ff)
        Exit Function
    ElseIf indicator = "AccDist" Then
        Set addIndicator = m.addAccDist(height, &H0000ff)
        Exit Function
    ElseIf indicator = "CLV" Then
        Set addIndicator = m.addCLV(height, &H0000ff)
        Exit Function
    ElseIf indicator = "WilliamR" Then
        Set addIndicator = m.addWilliamR(height, 14, &H800080, 30, &Hff6666, &H6666ff)
        Exit Function
    ElseIf indicator = "Aroon" Then
        Set addIndicator = m.addAroon(height, 14, &H339933, &H333399)
        Exit Function
    ElseIf indicator = "AroonOsc" Then
        Set addIndicator = m.addAroonOsc(height, 14, &H0000ff)
        Exit Function
    ElseIf indicator = "CCI" Then
        Set addIndicator = m.addCCI(height, 20, &H800080, 100, &Hff6666, &H6666ff)
        Exit Function
    ElseIf indicator = "EMV" Then
        Set addIndicator = m.addEaseOfMovement(height, 9, &H006060, &H606000)
        Exit Function
    ElseIf indicator = "MDX" Then
        Set addIndicator = m.addMassIndex(height, &H800080, &Hff6666, &H6666ff)
        Exit Function
    ElseIf indicator = "CVolatility" Then
        Set addIndicator = m.addChaikinVolatility(height, 10, 10, &H0000ff)
        Exit Function
    ElseIf indicator = "COscillator" Then
        Set addIndicator = m.addChaikinOscillator(height, &H0000ff)
        Exit Function
    ElseIf indicator = "CMF" Then
        Set addIndicator = m.addChaikinMoneyFlow(height, 21, &H008000)
        Exit Function
    ElseIf indicator = "NVI" Then
        Set addIndicator = m.addNVI(height, 255, &H0000ff, &H883333)
        Exit Function
    ElseIf indicator = "PVI" Then
        Set addIndicator = m.addPVI(height, 255, &H0000ff, &H883333)
        Exit Function
    ElseIf indicator = "MFI" Then
        Set addIndicator = m.addMFI(height, 14, &H800080, 30, &Hff6666, &H6666ff)
        Exit Function
    ElseIf indicator = "PVO" Then
        Set addIndicator = m.addPVO(height, 26, 12, 9, &H0000ff, &Hff00ff, &H008000)
        Exit Function
    ElseIf indicator = "PPO" Then
        Set addIndicator = m.addPPO(height, 26, 12, 9, &H0000ff, &Hff00ff, &H008000)
        Exit Function
    ElseIf indicator = "UO" Then
        Set addIndicator = m.addUltimateOscillator(height, 7, 14, 28, &H800080, 20, &Hff6666, _
            &H6666ff)
        Exit Function
    ElseIf indicator = "Vol" Then
        Set addIndicator = m.addVolIndicator(height, &H99ff99, &Hff9999, &Hc0c0c0)
        Exit Function
    ElseIf indicator = "TRIX" Then
        Set addIndicator = m.addTRIX(height, 12, &H0000ff)
        Exit Function
    End If
    Set addIndicator = Nothing
    Exit Function
End Function

'/ <summary>
'/ Creates a dummy chart to show an error message.
'/ </summary>
'/ <param name="msg">The error message.
'/ <returns>The BaseChart object containing the error message.</returns>
Function errMsg(msg)
    Set m = cd.MultiChart(400, 200)
    Call m.addTitle2(cd.Center, msg, "Arial", 10).setMaxWidth(m.getWidth())
    Set errMsg = m
    Exit Function
End Function

' Create the finance chart
Set c = drawChart()

' Output the chart
Set viewer = cd.WebChartViewer(Request, "chart1")
Call viewer.setChart(c, cd.SVG)

' Stream chart to the browser
Set viewer = cd.WebChartViewer(Request, "chart1")
Call viewer.setChart(c, cd.SVG)
Call viewer.streamChart(Response)
Call Response.End
%>
The user interface of the Interactive Financial Chart is laid out visually by the VB IDE. The code can be roughly divided into 3 main parts.
- The first part of the code is to initialize the user interface.
- The second part of the code is the get15MinData, getDailyData, getWeeklyData and getMonthlyData functions, which are for retrieving stock data. In this example, they just retrieve data from a random number generator. You may replace the code in these functions with your own code to get data from your data source.
- The third part of the code is the drawChart function. This is the real charting code, which creates a FinanceChart object, set data to it, and configures it according to the states of the user controls.
[
Windows Version (in Visual Basic)] vbdemo\FinanceDemo.frm
Option Explicit

Private cd As New ChartDirector.API

' A flag to indicate if the controls has been initialized - we suspend event
' processing during initialization
Private hasInitializedControls As Boolean

' A flag to indicate if the combo box key maps has been initialized.
Private hasInitializedKeyMap As Boolean

' In VB, when a user selects from a combo box, the control will return the
' selected text directly. We want to translate it to some internal "key" for
' processing. For example, if the user selects "Rate of Change", we want to
' represent the selection as "ROC" internally. In this way, we can change the
' user visible names (eg. using non-English language) without affecting the
' programming logic. So we use a Collection to each combo box for translating
' the selected text to the internal representation.
Private TimeRangeMap As New Collection
Private ChartSizeMap As New Collection
Private ChartTypeMap As New Collection
Private BandMap As New Collection
Private AvgType1Map As New Collection
Private AvgType2Map As New Collection
Private Indicator1Map As New Collection
Private Indicator2Map As New Collection
Private Indicator3Map As New Collection
Private Indicator4Map As New Collection

' A flag to indicate if the user is entering text on the moving average TextBox.
' We will update the chart when the text is changed.
Private textBoxHasChanged As Boolean

' The ticker symbol, timeStamps, volume, high, low, open and close data
Private tickerKey As String
Private timeStamps()
Private volData()
Private highData()
Private lowData()
Private openData()
Private closeData()

' An extra data series to compare with the close data
Private compareKey As String
Private compareData()

' The resolution of the data in seconds. 1 day = 86400 seconds.
Private resolution As Long

Private Sub Form_Load()
    ' Initialize controls
    initControls

    ' Center the Form on the screen
    Me.Width = ScaleX(960, vbPixels, Me.ScaleMode)
    Me.Left = (Screen.Width - Me.Width) / 2
    Me.Top = (Screen.height - Me.height) / 2

    ' Show the chart
    drawChart
End Sub

Private Sub Form_Resize()
    ' Make the top label the same width as the Form
    TopLabel.Left = 0
    TopLabel.Top = 0
    TopLabel.Width = Me.ScaleWidth

    ' Make the left panel the same height as the Form
    LeftPanel.Left = 0
    LeftPanel.Top = TopLabel.Top + TopLabel.height
    If Me.ScaleHeight > LeftPanel.Top Then
        LeftPanel.height = Me.ScaleHeight - LeftPanel.Top
    End If
End Sub

'
' A utility to add an item to a combo box, and simultaneously update the key/value
' mapping table
'
Private Sub AddToComboBox(ByVal control As ComboBox, ByVal keyValueTable As Collection, ByVal key As String, ByVal value As String)
    ' Add user visible text to the combo box
    control.AddItem value
    If Not hasInitializedKeyMap Then
        ' Update the map the translates the user visible text to an internal key
        keyValueTable.Add key, value
    End If
End Sub

'
' Initialize an technical indicator combo box
'
Private Sub InitIndicator(ByVal control As ComboBox, ByVal keyValueTable As Collection)
    AddToComboBox control, keyValueTable, "None", "None"
    AddToComboBox control, keyValueTable, "AccDist", "Accumulation/Distribution"
    AddToComboBox control, keyValueTable, "AroonOsc", "Aroon Oscillator"
    AddToComboBox control, keyValueTable, "Aroon", "Aroon Up/Down"
    AddToComboBox control, keyValueTable, "ADX", "Avg Directional Index"
    AddToComboBox control, keyValueTable, "ATR", "Avg True Range"
    AddToComboBox control, keyValueTable, "BBW", "Bollinger Band Width"
    AddToComboBox control, keyValueTable, "CMF", "Chaikin Money Flow"
    AddToComboBox control, keyValueTable, "COscillator", "Chaikin Oscillator"
    AddToComboBox control, keyValueTable, "CVolatility", "Chaikin Volatility"
    AddToComboBox control, keyValueTable, "CLV", "Close Location Value"
    AddToComboBox control, keyValueTable, "CCI", "Commodity Channel Index"
    AddToComboBox control, keyValueTable, "DPO", "Detrended Price Osc"
    AddToComboBox control, keyValueTable, "DCW", "Donchian Channel Width"
    AddToComboBox control, keyValueTable, "EMV", "Ease of Movement"
    AddToComboBox control, keyValueTable, "FStoch", "Fast Stochastic"
    AddToComboBox control, keyValueTable, "MACD", "MACD"
    AddToComboBox control, keyValueTable, "MDX", "Mass Index"
    AddToComboBox control, keyValueTable, "Momentum", "Momentum"
    AddToComboBox control, keyValueTable, "MFI", "Money Flow Index"
    AddToComboBox control, keyValueTable, "NVI", "Neg Volume Index"
    AddToComboBox control, keyValueTable, "OBV", "On Balance Volume"
    AddToComboBox control, keyValueTable, "Performance", "Performance"
    AddToComboBox control, keyValueTable, "PPO", "% Price Oscillator"
    AddToComboBox control, keyValueTable, "PVO", "% Volume Oscillator"
    AddToComboBox control, keyValueTable, "PVI", "Pos Volume Index"
    AddToComboBox control, keyValueTable, "PVT", "Price Volume Trend"
    AddToComboBox control, keyValueTable, "ROC", "Rate of Change"
    AddToComboBox control, keyValueTable, "RSI", "RSI"
    AddToComboBox control, keyValueTable, "SStoch", "Slow Stochastic"
    AddToComboBox control, keyValueTable, "StochRSI", "StochRSI"
    AddToComboBox control, keyValueTable, "TRIX", "TRIX"
    AddToComboBox control, keyValueTable, "UO", "Ultimate Oscillator"
    AddToComboBox control, keyValueTable, "Vol", "Volume"
    AddToComboBox control, keyValueTable, "WilliamR", "William's %R"
End Sub

'
' Initialize the controls
'
Private Sub initControls()
    ' We need to suspend event processing (eg. updating the chart) when the controls
    ' are being initialized.
    hasInitializedControls = False

    AddToComboBox TimeRange, TimeRangeMap, "1", "1 day"
    AddToComboBox TimeRange, TimeRangeMap, "2", "2 days"
    AddToComboBox TimeRange, TimeRangeMap, "5", "5 days"
    AddToComboBox TimeRange, TimeRangeMap, "10", "10 days"
    AddToComboBox TimeRange, TimeRangeMap, "30", "1 month"
    AddToComboBox TimeRange, TimeRangeMap, "60", "2 months"
    AddToComboBox TimeRange, TimeRangeMap, "90", "3 months"
    AddToComboBox TimeRange, TimeRangeMap, "180", "6 months"
    AddToComboBox TimeRange, TimeRangeMap, "360", "1 year"
    AddToComboBox TimeRange, TimeRangeMap, "720", "2 years"
    AddToComboBox TimeRange, TimeRangeMap, "1080", "3 years"
    AddToComboBox TimeRange, TimeRangeMap, "1440", "4 years"
    AddToComboBox TimeRange, TimeRangeMap, "1800", "5 years"
    AddToComboBox TimeRange, TimeRangeMap, "3600", "10 years"
    TimeRange.Text = "6 months"

    AddToComboBox ChartSize, ChartSizeMap, "S", "Small"
    AddToComboBox ChartSize, ChartSizeMap, "M", "Medium"
    AddToComboBox ChartSize, ChartSizeMap, "L", "Large"
    AddToComboBox ChartSize, ChartSizeMap, "H", "Huge"
    ChartSize.Text = "Large"

    AddToComboBox ChartType, ChartTypeMap, "None", "None"
    AddToComboBox ChartType, ChartTypeMap, "CandleStick", "CandleStick"
    AddToComboBox ChartType, ChartTypeMap, "Close", "Closing Price"
    AddToComboBox ChartType, ChartTypeMap, "Median", "Median Price"
    AddToComboBox ChartType, ChartTypeMap, "OHLC", "OHLC"
    AddToComboBox ChartType, ChartTypeMap, "TP", "Typical Price"
    AddToComboBox ChartType, ChartTypeMap, "WC", "Weighted Close"
    ChartType.Text = "CandleStick"

    AddToComboBox Band, BandMap, "None", "None"
    AddToComboBox Band, BandMap, "BB", "Bollinger Band"
    AddToComboBox Band, BandMap, "DC", "Donchain Channel"
    AddToComboBox Band, BandMap, "Envelop", "Envelop (SMA 20 +/- 10%)"
    Band.Text = "Bollinger Band"

    AddToComboBox AvgType1, AvgType1Map, "None", "None"
    AddToComboBox AvgType1, AvgType1Map, "SMA", "Simple"
    AddToComboBox AvgType1, AvgType1Map, "EMA", "Exponential"
    AddToComboBox AvgType1, AvgType1Map, "TMA", "Triangular"
    AddToComboBox AvgType1, AvgType1Map, "WMA", "Weighted"
    AvgType1.Text = "Simple"

    AddToComboBox AvgType2, AvgType2Map, "None", "None"
    AddToComboBox AvgType2, AvgType2Map, "SMA", "Simple"
    AddToComboBox AvgType2, AvgType2Map, "EMA", "Exponential"
    AddToComboBox AvgType2, AvgType2Map, "TMA", "Triangular"
    AddToComboBox AvgType2, AvgType2Map, "WMA", "Weighted"
    AvgType2.Text = "Simple"

    InitIndicator Indicator1, Indicator1Map
    InitIndicator Indicator2, Indicator2Map
    InitIndicator Indicator3, Indicator3Map
    InitIndicator Indicator4, Indicator4Map
    Indicator1.Text = "RSI"
    Indicator2.Text = "MACD"
    Indicator3.Text = "None"
    Indicator4.Text = "None"

    hasInitializedControls = True
    hasInitializedKeyMap = True
End Sub

'/ <summary>
'/ Get the timeStamps, highData, lowData, openData, closeData and volData.
'/ </summary>
'/ <param name="ticker">The ticker symbol for the data series.</param>
'/ <param name="startDate">The starting date/time for the data series.</param>
'/ <param name="endDate">The ending date/time for the data series.</param>
'/ <param name="durationInDays">The number of trading days to get.</param>
'/ <param name="extraPoints">The extra leading data points needed in order to
'/ compute moving averages.</param>
'/ <returns>True if successfully obtain the data, otherwise false.</returns>
Function getData(ByVal ticker As String, ByVal StartDate As Date, ByVal endDate As Date, _
        ByVal durationInDays As Integer, ByVal extraPoints As Integer) As Boolean

    ' This method should return false if the ticker symbol is invalid. In this sample
    ' code, as we are using a random number generator for the data, all ticker symbol
    ' is allowed, but we still assumed an empty symbol is invalid.
    If ticker = "" Then
        getData = False
        Exit Function
    End If

    ' In this demo, we can get 15 min, daily, weekly or monthly data depending on the
    ' time range.
    Dim dataPointsPerDay As Long
    Dim adjustedStartDate As Date

    resolution = 86400
    If durationInDays <= 10 Then
        ' 10 days or less, we assume 15 minute data points are available
        resolution = 900

        ' We need to adjust the startDate backwards for the extraPoints. We assume
        ' 6.5 hours trading time per day, and 5 trading days per week.
        dataPointsPerDay = 6.5 * 3600 / resolution
        adjustedStartDate = DateSerial(Year(StartDate), Month(StartDate), Day(StartDate) - _
            Int(extraPoints / dataPointsPerDay * 7 / 5 + 0.9999999) - 2)

        ' Get the required 15 min data
        Call get15MinData(ticker, adjustedStartDate, endDate)

    ElseIf durationInDays >= 4.5 * 360 Then
        ' 4 years or more - use monthly data points.
        resolution = 30 * 86400

        ' Adjust startDate backwards to cater for extraPoints
        adjustedStartDate = DateAdd("m", -extraPoints, StartDate)

        ' Get the required monthly data
        Call getMonthlyData(ticker, adjustedStartDate, endDate)

    ElseIf durationInDays >= 1.5 * 360 Then
        ' 1 year or more - use weekly points.
        resolution = 7 * 86400

        ' Adjust startDate backwards to cater for extraPoints
        adjustedStartDate = DateAdd("d", -extraPoints * 7 - 6, StartDate)

        ' Get the required weekly data
        Call getWeeklyData(ticker, adjustedStartDate, endDate)

    Else
        ' Default - use daily points
        resolution = 86400

        ' Adjust startDate backwards to cater for extraPoints. We multiply the days
        ' by 7/5 as we assume 1 week has 5 trading days.
        adjustedStartDate = DateSerial(Year(StartDate), Month(StartDate), Day(StartDate) - _
            Int((extraPoints * 7 + 4) / 5) - 2)

        ' Get the required daily data
        Call getDailyData(ticker, adjustedStartDate, endDate)
    End If

    getData = True

End Function

'/ <summary>
'/ Get 15 minutes data series for timeStamps, highData, lowData, openData, closeData
'/ and volData.
'/ </summary>
'/ <param name="startDate">The starting date/time for the data series.</param>
'/ <param name="endDate">The ending date/time for the data series.</param>
Sub get15MinData(ByVal ticker As String, ByVal StartDate As Date, ByVal endDate As Date)
    '
    ' In this demo, we use a random number generator to generate the data. In
    ' practice, you may get the data from a database or by other means. If you do not
    ' have 15 minute data, you may modify the "drawChart" method below to not using
    ' 15 minute data.
    '
    Call generateRandomData(ticker, StartDate, endDate, 900)
End Sub

'/ <summary>
'/ Get daily data series for timeStamps, highData, lowData, openData, closeData
'/ and volData.
'/ </summary>
'/ <param name="startDate">The starting date/time for the data series.</param>
'/ <param name="endDate">The ending date/time for the data series.</param>
Sub getDailyData(ByVal ticker As String, ByVal StartDate As Date, ByVal endDate As Date)
    '
    ' In this demo, we use a random number generator to generate the data. In
    ' practice, you may get the data from a database or by other means.
    '
    Call generateRandomData(ticker, StartDate, endDate, 86400)
End Sub

'/ <summary>
'/ Get weekly data series for timeStamps, highData, lowData, openData, closeData
'/ and volData.
'/ </summary>
'/ <param name="startDate">The starting date/time for the data series.</param>
'/ <param name="endDate">The ending date/time for the data series.</param>
Sub getWeeklyData(ByVal ticker As String, ByVal StartDate As Date, ByVal endDate As Date)
    '
    ' If you do not have weekly data, you may call "getDailyData(startDate, endDate)"
    ' to get daily data, then call "convertDailyToWeeklyData()" to convert to weekly
    ' data.
    '
    Call generateRandomData(ticker, StartDate, endDate, 86400 * 7)
End Sub

'/ <summary>
'/ Get monthly data series for timeStamps, highData, lowData, openData, closeData
'/ and volData.
'/ </summary>
'/ <param name="startDate">The starting date/time for the data series.</param>
'/ <param name="endDate">The ending date/time for the data series.</param>
Sub getMonthlyData(ByVal ticker As String, ByVal StartDate As Date, ByVal endDate As Date)
    '
    ' If you do not have weekly data, you may call "getDailyData(startDate, endDate)"
    ' to get daily data, then call "convertDailyToMonthlyData()" to convert to
    ' monthly data.
    '
    Call generateRandomData(ticker, StartDate, endDate, 86400 * 30)
End Sub

'/ <summary>
'/ A random number generator designed to generate realistic financial data.
'/ </summary>
'/ <param name="startDate">The starting date/time for the data series.</param>
'/ <param name="endDate">The ending date/time for the data series.</param>
'/ <param name="resolution">The period of the data series.</param>
Sub generateRandomData(ByVal ticker As String, ByVal StartDate As Date, ByVal endDate As Date, _
    ByVal resolution As Long)
    Dim db As FinanceSimulator
    Set db = cd.FinanceSimulator(ticker, StartDate, endDate, resolution)
    timeStamps = cd.NTime(db.getTimeStamps())
    highData = db.getHighData()
    lowData = db.getLowData()
    openData = db.getOpenData()
    closeData = db.getCloseData()
    volData = db.getVolData()
End Sub

'/ <summary>
'/ A utility to convert daily to weekly data.
'/ </summary>
Sub convertDailyToWeeklyData()
    Call aggregateData(cd.ArrayMath(timeStamps).selectStartOfWeek())
End Sub

'/ <summary>
'/ A utility to convert daily to monthly data.
'/ </summary>
Sub convertDailyToMonthlyData()
    Call aggregateData(cd.ArrayMath(timeStamps).selectStartOfMonth())
End Sub

'/ <summary>
'/ An internal method used to aggregate daily data.
'/ </summary>
Sub aggregateData(ByVal aggregator As ArrayMath)
    timeStamps = cd.NTime(aggregator.aggregate(cd.CTime(timeStamps), _
        cd.AggregateFirst))
    highData = aggregator.aggregate(highData, cd.AggregateMax)
    lowData = aggregator.aggregate(lowData, cd.AggregateMin)
    openData = aggregator.aggregate(openData, cd.AggregateFirst)
    closeData = aggregator.aggregate(closeData, cd.AggregateLast)
    volData = aggregator.aggregate(volData, cd.AggregateSum)
End Sub

'/ <summary>
'/ Create a financial chart according to user selections.
'/ </summary>
Sub drawChart()

    'reset the changed flag
    textBoxHasChanged = False

    Dim i As Integer

    ' In this demo, we just assume we plot up to the latest time. So end date is now.
    Dim endDate As Date
    endDate = Now

    ' If the trading day has not yet started (before 9:30am), or if the end date is
    ' on on Sat or Sun, we set the end date to 4:00pm of the last trading day
    Do While Hour(endDate) * 60 + Minute(endDate) < 9 * 60 + 30 Or _
        Weekday(endDate) = vbSunday Or Weekday(endDate) = vbSaturday
        endDate = DateSerial(Year(endDate), Month(endDate), Day(endDate) - 1) + _
            TimeSerial(16, 0, 0)
    Loop

    ' The duration selected by the user
    Dim durationInDays As Long
    durationInDays = CInt(TimeRangeMap(TimeRange.Text))

    ' Compute the start date by subtracting the duration from the end date.
    Dim StartDate As Date
    StartDate = endDate
    If durationInDays >= 30 Then
        ' More or equal to 30 days - so we use months as the unit
        StartDate = DateSerial(Year(endDate), Month(endDate) - durationInDays / 30, 1)
    Else
        ' Less than 30 days - use day as the unit. The starting point of the axis is
        ' always at the start of the day (9:30am). Note that we use trading days, so
        ' we skip Sat and Sun in counting the days.
        StartDate = DateSerial(Year(endDate), Month(endDate), Day(endDate)) + _
            TimeSerial(9, 30, 0)
        For i = 1 To durationInDays - 1
            If Weekday(StartDate) = vbMonday Then
                StartDate = DateAdd("d", -3, StartDate)
            Else
                StartDate = DateAdd("d", -1, StartDate)
            End If
        Next
    End If

    'The moving average periods selected by the user.
    Dim avgPeriod1 As Long
    If IsNumeric(MovAvg1.Text) Then
        avgPeriod1 = CInt(MovAvg1.Text)
    Else
        avgPeriod1 = 0
    End If

    Dim avgPeriod2 As Long
    If IsNumeric(MovAvg2.Text) Then
        avgPeriod2 = CInt(MovAvg2.Text)
    Else
        avgPeriod2 = 0
    End If

    If avgPeriod1 < 0 Then
        avgPeriod1 = 0
    ElseIf avgPeriod1 > 300 Then
        avgPeriod1 = 300
    End If

    If avgPeriod2 < 0 Then
        avgPeriod2 = 0
    ElseIf avgPeriod2 > 300 Then
        avgPeriod2 = 300
    End If

    'We need extra leading data points in order to compute moving averages.
    Dim extraPoints As Long
    extraPoints = 20
    If avgPeriod1 > extraPoints Then
        extraPoints = avgPeriod1
    End If
    If avgPeriod2 > extraPoints Then
        extraPoints = avgPeriod2
    End If

    ' Get the data series to compare with, if any.
    compareKey = Trim(CompareWith.Text)
    compareData = Array()
    If getData(compareKey, StartDate, endDate, durationInDays, extraPoints) Then
        compareData = closeData
    End If

    ' The data series we want to get.
    tickerKey = Trim(TickerSymbol.Text)
    If Not getData(tickerKey, StartDate, endDate, durationInDays, extraPoints) Then
        Call errMsg("Please enter a valid ticker symbol")
        Exit Sub
    End If

    ' We now confirm the actual number of extra points (data points that are before
    ' the start date) as inferred using actual data from the database.
    extraPoints = UBound(timeStamps) + 1
    For i = 0 To UBound(timeStamps)
        If timeStamps(i) >= StartDate Then
            extraPoints = i
            Exit For
        End If
    Next

    ' Check if there is any valid data
    If extraPoints >= UBound(timeStamps) + 1 Then
        ' No data - just display the no data message.
        Call errMsg("No data available for the specified time period")
        Exit Sub
    End If

    ' In some finance chart presentation style, even if the data for the latest day
    ' is not fully available, the axis for the entire day will still be drawn, where
    ' no data will appear near the end of the axis.
    If resolution < 86400 Then
        ' Add extra points to the axis until it reaches the end of the day. The end
        ' of day is assumed to be 16:00 (it depends on the stock exchange).
        Dim lastTime As Date
        lastTime = timeStamps(UBound(timeStamps))

        Dim extraTrailingPoints As Long
        extraTrailingPoints = Int((16 * 3600# - Hour(lastTime) * 3600 - Minute(lastTime) * 60 - _
            Second(lastTime)) / resolution)
        If extraTrailingPoints > 0 Then
            Dim originalSize As Long
            originalSize = UBound(timeStamps) + 1
            ReDim Preserve timeStamps(originalSize + extraTrailingPoints - 1)
            For i = 0 To extraTrailingPoints - 1
                timeStamps(originalSize + i) = DateAdd("s", resolution * i, lastTime)
            Next
        End If
    End If

    '
    ' At this stage, all data is available. We can draw the chart as according to
    ' user input.
    '

    '
    ' Determine the chart size. In this demo, user can select 4 different chart sizes.
    ' Default is the large chart size.
    '
    Dim chartWidth As Long
    chartWidth = 780
    Dim mainHeight As Long
    mainHeight = 255
    Dim indicatorHeight As Long
    indicatorHeight = 80

    Dim chartSizeKey As String
    chartSizeKey = ChartSizeMap(ChartSize.Text)
    If chartSizeKey = "S" Then
        ' Small chart size
        chartWidth = 450
        mainHeight = 160
        indicatorHeight = 60
    ElseIf chartSizeKey = "M" Then
        ' Medium chart size
        chartWidth = 620
        mainHeight = 215
        indicatorHeight = 70
    ElseIf chartSizeKey = "H" Then
        ' Huge chart size
        chartWidth = 1000
        mainHeight = 320
        indicatorHeight = 90
    End If

    ' Create the chart object using the selected size
    Dim m As FinanceChart
    Set m = cd.FinanceChart(chartWidth)

    ' Set the data into the chart object
    Call m.SetData(timeStamps, highData, lowData, openData, closeData, volData, extraPoints)

    '
    ' We configure the title of the chart. In this demo chart design, we put the
    ' company name as the top line of the title with left alignment.
    '
    Call m.addPlotAreaTitle(cd.TopLeft, tickerKey)

    ' We displays the current date as well as the data resolution on the next line.
    Dim resolutionText As String
    resolutionText = ""
    If resolution = 30 * 86400 Then
        resolutionText = "Monthly"
    ElseIf resolution = 7 * 86400 Then
        resolutionText = "Weekly"
    ElseIf resolution = 86400 Then
        resolutionText = "Daily"
    ElseIf resolution = 900 Then
        resolutionText = "15-min"
    End If

    Call m.addPlotAreaTitle(cd.BottomLeft, "<*font=arial.ttf,size=8*>" & m.formatValue(Now, _
        "mmm dd, yyyy") & " - " & resolutionText & " chart")

    ' A copyright message at the bottom left corner the title area
    Call m.addPlotAreaTitle(cd.BottomRight, _
        "<*font=arial.ttf,size=8*>(c) Advanced Software Engineering")

    '
    ' Add the first techical indicator according. In this demo, we draw the first
    ' indicator on top of the main chart.
    '
    Call addIndicator(m, Indicator1Map(Indicator1.Text), indicatorHeight)

    '
    ' Add the main chart
    '
    Call m.addMainChart(mainHeight)

    '
    ' Set log or linear scale according to user preference
    '
    Call m.setLogScale(LogScale.value)

    '
    ' Set axis labels to show data values or percentage change to user preference
    '
    If PercentageScale.value Then
        Call m.setPercentageAxis
    End If

    '
    ' Draw the main chart depending on the chart type the user has selected
    '
    Dim chartTypeKey As String
    chartTypeKey = ChartTypeMap(ChartType.Text)
    If chartTypeKey = "Close" Then
        Call m.addCloseLine(&H40)
    ElseIf chartTypeKey = "TP" Then
        Call m.addTypicalPrice(&H40)
    ElseIf chartTypeKey = "WC" Then
        Call m.addWeightedClose(&H40)
    ElseIf chartTypeKey = "Median" Then
        Call m.addMedianPrice(&H40)
    End If

    '
    ' Add comparison line if there is data for comparison
    '
    If UBound(compareData) > 0 Then
        If UBound(compareData) + 1 > extraPoints Then
            Call m.addComparison(compareData, &HFF, compareKey)
        End If
    End If

    '
    ' Add moving average lines.
    '
    Call addMovingAvg(m, AvgType1Map(AvgType1.Text), avgPeriod1, &H663300)
    Call addMovingAvg(m, AvgType2Map(AvgType2.Text), avgPeriod2, &H9900FF)

    '
    ' Draw the main chart if the user has selected CandleStick or OHLC. We
    ' draw it here to make sure it is drawn behind the moving average lines
    ' (that is, the moving average lines stay on top.)
    '
    If chartTypeKey = "CandleStick" Then
        Call m.addCandleStick(&H33FF33, &HFF3333)
    ElseIf chartTypeKey = "OHLC" Then
        Call m.addHLOC(&H8800, &HCC0000)
    End If


    '
    ' Add parabolic SAR if necessary
    '
    If ParabolicSAR.value Then
        Call m.addParabolicSAR(0.02, 0.02, 0.2, cd.DiamondShape, 5, &H8800, &H0)
    End If

    '
    ' Add price band/channel/envelop to the chart according to user selection
    '
    Dim bandType As String
    bandType = BandMap(Band.Text)
    If bandType = "BB" Then
        Call m.addBollingerBand(20, 2, &H9999FF, &HC06666FF)
    ElseIf bandType = "DC" Then
        Call m.addDonchianChannel(20, &H9999FF, &HC06666FF)
    ElseIf bandType = "Envelop" Then
        Call m.addEnvelop(20, 0.1, &H9999FF, &HC06666FF)
    End If

    '
    ' Add volume bars to the main chart if necessary
    '
    If VolumeBars.value Then
        Call m.addVolBars(indicatorHeight, &H99FF99, &HFF9999, &HC0C0C0)
    End If

    '
    ' Add additional indicators as according to user selection.
    '
    Call addIndicator(m, Indicator2Map(Indicator2.Text), indicatorHeight)
    Call addIndicator(m, Indicator3Map(Indicator3.Text), indicatorHeight)
    Call addIndicator(m, Indicator4Map(Indicator4.Text), indicatorHeight)

    Set ChartViewer1.Picture = m.makePicture()
    ChartViewer1.ImageMap = m.getHTMLImageMap("", "", _
        "title='" & m.getToolTipDateFormat() & " {value|G}'")
End Sub


' <summary>
' Add a moving average line to the FinanceChart object.
' </summary>
' <param name="m">The FinanceChart object to add the line to.</param>
' <param name="avgType">The moving average type (SMA/EMA/TMA/WMA).</param>
' <param name="avgPeriod">The moving average period.</param>
' <param name="color">The color of the line.</param>
' <returns>The LineLayer object representing line layer created.</returns>
Function addMovingAvg(ByVal m As FinanceChart, ByVal avgType As String, ByVal avgPeriod As Long, ByVal color As Long)
    Set addMovingAvg = Nothing
    If avgPeriod > 1 Then
        If avgType = "SMA" Then
            Set addMovingAvg = m.addSimpleMovingAvg(avgPeriod, color)
        ElseIf avgType = "EMA" Then
            Set addMovingAvg = m.addExpMovingAvg(avgPeriod, color)
        ElseIf avgType = "TMA" Then
            Set addMovingAvg = m.addTriMovingAvg(avgPeriod, color)
        ElseIf avgType = "WMA" Then
            Set addMovingAvg = m.addWeightedMovingAvg(avgPeriod, color)
        End If
    End If
End Function


' <summary>
' Add an indicator chart to the FinanceChart object. In this demo example, the indicator
' parameters (such as the period used to compute RSI, colors of the lines, etc.) are hard
' coded to commonly used values. You are welcome to design a more complex user interface
' to allow users to set the parameters.
' </summary>
' <param name="m">The FinanceChart object to add the line to.</param>
' <param name="indicator">The selected indicator.</param>
' <param name="height">Height of the chart in pixels</param>
'/ <returns>The XYChart object representing indicator chart.</returns>
Function addIndicator(ByVal m As FinanceChart, ByVal indicator As String, ByVal height As Long)
    Set addIndicator = Nothing
    If indicator = "RSI" Then
        Set addIndicator = m.addRSI(height, 14, &H800080, 20, &HFF6666, &H6666FF)
    ElseIf indicator = "StochRSI" Then
        Set addIndicator = m.addStochRSI(height, 14, &H800080, 30, &HFF6666, &H6666FF)
    ElseIf indicator = "MACD" Then
        Set addIndicator = m.addMACD(height, 26, 12, 9, &HFF, &HFF00FF, &H8000)
    ElseIf indicator = "FStoch" Then
        Set addIndicator = m.addFastStochastic(height, 14, 3, &H6060, &H606000)
    ElseIf indicator = "SStoch" Then
        Set addIndicator = m.addSlowStochastic(height, 14, 3, &H6060, &H606000)
    ElseIf indicator = "ATR" Then
        Set addIndicator = m.addATR(height, 14, &H808080, &HFF)
    ElseIf indicator = "ADX" Then
        Set addIndicator = m.addADX(height, 14, &H8000, &H800000, &H80)
    ElseIf indicator = "DCW" Then
        Set addIndicator = m.addDonchianWidth(height, 20, &HFF)
    ElseIf indicator = "BBW" Then
        Set addIndicator = m.addBollingerWidth(height, 20, 2, &HFF)
    ElseIf indicator = "DPO" Then
        Set addIndicator = m.addDPO(height, 20, &HFF)
    ElseIf indicator = "PVT" Then
        Set addIndicator = m.addPVT(height, &HFF)
    ElseIf indicator = "Momentum" Then
        Set addIndicator = m.addMomentum(height, 12, &HFF)
    ElseIf indicator = "Performance" Then
        Set addIndicator = m.addPerformance(height, &HFF)
    ElseIf indicator = "ROC" Then
        Set addIndicator = m.addROC(height, 12, &HFF)
    ElseIf indicator = "OBV" Then
        Set addIndicator = m.addOBV(height, &HFF)
    ElseIf indicator = "AccDist" Then
        Set addIndicator = m.addAccDist(height, &HFF)
    ElseIf indicator = "CLV" Then
        Set addIndicator = m.addCLV(height, &HFF)
    ElseIf indicator = "WilliamR" Then
        Set addIndicator = m.addWilliamR(height, 14, &H800080, 30, &HFF6666, &H6666FF)
    ElseIf indicator = "Aroon" Then
        Set addIndicator = m.addAroon(height, 14, &H339933, &H333399)
    ElseIf indicator = "AroonOsc" Then
        Set addIndicator = m.addAroonOsc(height, 14, &HFF)
    ElseIf indicator = "CCI" Then
        Set addIndicator = m.addCCI(height, 20, &H800080, 100, &HFF6666, &H6666FF)
    ElseIf indicator = "EMV" Then
        Set addIndicator = m.addEaseOfMovement(height, 9, &H6060, &H606000)
    ElseIf indicator = "MDX" Then
        Set addIndicator = m.addMassIndex(height, &H800080, &HFF6666, &H6666FF)
    ElseIf indicator = "CVolatility" Then
        Set addIndicator = m.addChaikinVolatility(height, 10, 10, &HFF)
    ElseIf indicator = "COscillator" Then
        Set addIndicator = m.addChaikinOscillator(height, &HFF)
    ElseIf indicator = "CMF" Then
        Set addIndicator = m.addChaikinMoneyFlow(height, 21, &H8000)
    ElseIf indicator = "NVI" Then
        Set addIndicator = m.addNVI(height, 255, &HFF, &H883333)
    ElseIf indicator = "PVI" Then
        Set addIndicator = m.addPVI(height, 255, &HFF, &H883333)
    ElseIf indicator = "MFI" Then
        Set addIndicator = m.addMFI(height, 14, &H800080, 30, &HFF6666, &H6666FF)
    ElseIf indicator = "PVO" Then
        Set addIndicator = m.addPVO(height, 26, 12, 9, &HFF, &HFF00FF, &H8000)
    ElseIf indicator = "PPO" Then
        Set addIndicator = m.addPPO(height, 26, 12, 9, &HFF, &HFF00FF, &H8000)
    ElseIf indicator = "UO" Then
        Set addIndicator = m.addUltimateOscillator(height, 7, 14, 28, &H800080, 20, &HFF6666, &H6666FF)
    ElseIf indicator = "Vol" Then
        Set addIndicator = m.addVolIndicator(height, &H99FF99, &HFF9999, &HC0C0C0)
    ElseIf indicator = "TRIX" Then
        Set addIndicator = m.addTRIX(height, 12, &HFF)
    End If
End Function

'/ <summary>
'/ Creates a dummy chart to show an error message.
'/ </summary>
'/ <param name="msg">The error message.
'/ <returns>The BaseChart object containing the error message.</returns>
Sub errMsg(ByVal msg As String)
    Dim m As MultiChart
    Set m = cd.MultiChart(400, 200)
    Call m.addTitle2(cd.Center, msg, "Arial", 10).setMaxWidth(m.getWidth())
    Set ChartViewer1.Picture = m.makePicture()
End Sub

Private Sub TimeRange_Click()
    If hasInitializedControls Then drawChart
End Sub

Private Sub ChartSize_Click()
    If hasInitializedControls Then drawChart
End Sub

Private Sub VolumeBars_Click()
    If hasInitializedControls Then drawChart
End Sub

Private Sub ParabolicSAR_Click()
    If hasInitializedControls Then drawChart
End Sub

Private Sub LogScale_Click()
    If hasInitializedControls Then drawChart
End Sub

Private Sub PercentageScale_Click()
    If hasInitializedControls Then drawChart
End Sub

Private Sub ChartType_Click()
    If hasInitializedControls Then drawChart
End Sub

Private Sub Band_Click()
    If hasInitializedControls Then drawChart
End Sub

Private Sub AvgType1_Click()
    If hasInitializedControls Then drawChart
End Sub

Private Sub AvgType2_Click()
    If hasInitializedControls Then drawChart
End Sub

Private Sub TickerSymbol_Change()
    'Don't update the chart yet when the user is still entering - just set a flag.
    'Update the chart only when hitting the Enter key or the text box loses focus.
    textBoxHasChanged = hasInitializedControls
End Sub

Private Sub CompareWith_Change()
    'Don't update the chart yet when the user is still entering - just set a flag.
    'Update the chart only when hitting the Enter key or the text box loses focus.
    textBoxHasChanged = hasInitializedControls
End Sub

Private Sub MovAvg1_Change()
    'Don't update the chart yet when the user is still entering - just set a flag.
    'Update the chart only when hitting the Enter key or the text box loses focus.
    textBoxHasChanged = hasInitializedControls
End Sub

Private Sub MovAvg2_Change()
    'Don't update the chart yet when the user is still entering - just set a flag.
    'Update the chart only when hitting the Enter key or the text box loses focus.
    textBoxHasChanged = hasInitializedControls
End Sub

Private Sub TickerSymbol_LostFocus()
    'User has finished entering - now can update the chart
    If textBoxHasChanged Then drawChart
End Sub

Private Sub CompareWith_LostFocus()
    'User has finished entering - now can update the chart
    If textBoxHasChanged Then drawChart
End Sub

Private Sub MovAvg1_LostFocus()
    'User has finished entering - now can update the chart
    If textBoxHasChanged Then drawChart
End Sub

Private Sub MovAvg2_LostFocus()
    'User has finished entering - now can update the chart
    If textBoxHasChanged Then drawChart
End Sub

Private Sub TickerSymbol_KeyPress(KeyAscii As Integer)
    'User has finished entering - now can update the chart
    If textBoxHasChanged And KeyAscii = 13 Then drawChart
End Sub

Private Sub CompareWith_KeyPress(KeyAscii As Integer)
    'User has finished entering - now can update the chart
    If textBoxHasChanged And KeyAscii = 13 Then drawChart
End Sub

Private Sub MovAvg1_KeyPress(KeyAscii As Integer)
    'User has finished entering - now can update the chart
    If textBoxHasChanged And KeyAscii = 13 Then drawChart
End Sub

Private Sub MovAvg2_KeyPress(KeyAscii As Integer)
    'User has finished entering - now can update the chart
    If textBoxHasChanged And KeyAscii = 13 Then drawChart
End Sub

Private Sub Indicator1_Click()
    If hasInitializedControls Then drawChart
End Sub

Private Sub Indicator2_Click()
    If hasInitializedControls Then drawChart
End Sub

Private Sub Indicator3_Click()
    If hasInitializedControls Then drawChart
End Sub

Private Sub Indicator4_Click()
    If hasInitializedControls Then drawChart
End Sub
© 2021 Advanced Software Engineering Limited. All rights reserved.