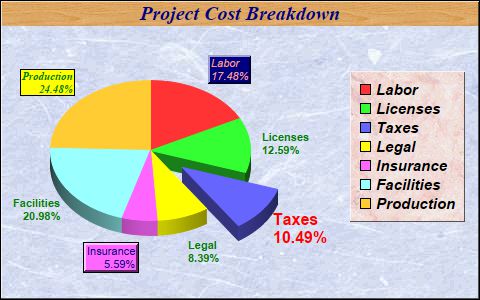
This example demonstrates various text styles, text colors, background colors and text box border effects.
In the chart above, 3 different pattern colors (wallpapers) are used for the chart background, legend box background and chart title background. In addition, the chart title, sector labels, and legends all have different fonts, text colors, background colors, and border styles.
[Web Version (in ASP)] aspdemo\fontpie.asp
<%@ language="vbscript" %>
<%
Set cd = CreateObject("ChartDirector.API")

' The data for the pie chart
data = Array(25, 18, 15, 12, 8, 30, 35)

' The labels for the pie chart
labels = Array("Labor", "Licenses", "Taxes", "Legal", "Insurance", "Facilities", "Production")

' Create a PieChart object of size 480 x 300 pixels
Set c = cd.PieChart(480, 300)

' Set default directory for loading images from current script directory
Call c.setSearchPath(Server.MapPath("."))

' Use a blue marble pattern as the background wallpaper, with a black border, and 1 pixel 3D border
' effect
Call c.setBackground(c.patternColor("marble.png"), &H000000, 1)

' Set the center of the pie at (150, 150) and the radius to 100 pixels
Call c.setPieSize(150, 150, 100)

' Add a title to the pie chart using Times Bold Italic/15 points/deep blue (0x000080) as font, with
' a wood pattern as the title background
Call c.addTitle("Project Cost Breakdown", "Times New Roman Bold Italic", 15, &H000080 _
    ).setBackground(c.patternColor("wood.png"))

' Draw the pie in 3D
Call c.set3D()

' Add a legend box using Arial Bold Italic/11 points font. Use a pink marble pattern as the
' background wallpaper, with a 1 pixel 3D border. The legend box is top-right aligned relative to
' the point (465, 70)
Set b = c.addLegend(465, 70, True, "Arial Bold Italic", 11)
Call b.setBackground(c.patternColor("marble2.png"), cd.Transparent, 1)
Call b.setAlignment(cd.TopRight)

' Set the default font for all sector labels to Arial Bold/8pt/dark green (0x008000).
Call c.setLabelStyle("Arial Bold", 8, &H008000)

' Set the pie data and the pie labels
Call c.setData(data, labels)

' Explode the 3rd sector
Call c.setExplode(2, 40)

' Use Arial Bold/12pt/red as label font for the 3rd sector
Call c.sector(2).setLabelStyle("Arial Bold", 12, &Hff0000)

' Use Arial/8pt/deep blue as label font for the 5th sector. Add a background box using the sector
' fill color (SameAsMainColor), with a black (0x000000) edge and 2 pixel 3D border.
Call c.sector(4).setLabelStyle("Arial", 8, &H000080).setBackground(cd.SameAsMainColor, &H000000, 2)

' Use Arial Italic/8pt/light red (0xff9999) as label font for the 6th sector. Add a dark blue
' (0x000080) background box with a 2 pixel 3D border.
Call c.sector(0).setLabelStyle("Arial Italic", 8, &Hff9999).setBackground(&H000080, _
    cd.Transparent, 2)

' Use Times Bold Italic/8pt/deep green (0x008000) as label font for 7th sector. Add a yellow
' (0xFFFF00) background box with a black (0x000000) edge.
Call c.sector(6).setLabelStyle("Times New Roman Bold Italic", 8, &H008000).setBackground(&Hffff00, _
    &H000000)

' Output the chart
Set viewer = cd.WebChartViewer(Request, "chart1")
Call viewer.setChart(c, cd.SVG)

' Include tool tip for the chart
viewer.ImageMap = c.getHTMLImageMap("", "", "title='{label}: US${value}K ({percent}%)'")
%>

<!DOCTYPE html>
<html>
<head>
    <title>Text Style and Colors</title>
    <!-- Include ChartDirector Javascript Library to support chart interactions -->
    <script type="text/javascript" src="cdjcv.js"></script>
</head>
<body style="margin:5px 0px 0px 5px">
    <div style="font:bold 18pt verdana;">
        Text Style and Colors
    </div>
    <hr style="border:solid 1px #000080; background:#000080" />
    <div style="font:10pt verdana; margin-bottom:1.5em">
        <a href="viewsource.asp?file=<%= Request("SCRIPT_NAME") %>">View Chart Source Code</a>
    </div>
    <!-- ****** Here is the chart image ****** -->
    <%= viewer.renderHTML() %>
</body>
</html>
[Windows Version (in Visual Basic)] vbdemo\fontpie.cls
Public Sub createChart(viewer As Object, chartIndex As Integer)

    Dim cd As New ChartDirector.API

    ' The data for the pie chart
    Dim data()
    data = Array(25, 18, 15, 12, 8, 30, 35)

    ' The labels for the pie chart
    Dim labels()
    labels = Array("Labor", "Licenses", "Taxes", "Legal", "Insurance", "Facilities", "Production")

    ' Create a PieChart object of size 480 x 300 pixels
    Dim c As PieChart
    Set c = cd.PieChart(480, 300)

    ' Use a blue marble pattern as the background wallpaper, with a black border, and 1 pixel 3D
    ' border effect
    Call c.setBackground(c.patternColor("marble.png"), &H000000, 1)

    ' Set the center of the pie at (150, 150) and the radius to 100 pixels
    Call c.setPieSize(150, 150, 100)

    ' Add a title to the pie chart using Times Bold Italic/15 points/deep blue (0x000080) as font,
    ' with a wood pattern as the title background
    Call c.addTitle("Project Cost Breakdown", "timesbi.ttf", 15, &H000080).setBackground( _
        c.patternColor("wood.png"))

    ' Draw the pie in 3D
    Call c.set3D()

    ' Add a legend box using Arial Bold Italic/11 points font. Use a pink marble pattern as the
    ' background wallpaper, with a 1 pixel 3D border. The legend box is top-right aligned relative
    ' to the point (465, 70)
    Dim b As LegendBox
    Set b = c.addLegend(465, 70, True, "arialbi.ttf", 11)
    Call b.setBackground(c.patternColor("marble2.png"), cd.Transparent, 1)
    Call b.setAlignment(cd.TopRight)

    ' Set the default font for all sector labels to Arial Bold/8pt/dark green (0x008000).
    Call c.setLabelStyle("arialbd.ttf", 8, &H008000)

    ' Set the pie data and the pie labels
    Call c.setData(data, labels)

    ' Explode the 3rd sector
    Call c.setExplode(2, 40)

    ' Use Arial Bold/12pt/red as label font for the 3rd sector
    Call c.sector(2).setLabelStyle("arialbd.ttf", 12, &Hff0000)

    ' Use Arial/8pt/deep blue as label font for the 5th sector. Add a background box using the
    ' sector fill color (SameAsMainColor), with a black (0x000000) edge and 2 pixel 3D border.
    Call c.sector(4).setLabelStyle("arial.ttf", 8, &H000080).setBackground(cd.SameAsMainColor, _
        &H000000, 2)

    ' Use Arial Italic/8pt/light red (0xff9999) as label font for the 6th sector. Add a dark blue
    ' (0x000080) background box with a 2 pixel 3D border.
    Call c.sector(0).setLabelStyle("ariali.ttf", 8, &Hff9999).setBackground(&H000080, _
        cd.Transparent, 2)

    ' Use Times Bold Italic/8pt/deep green (0x008000) as label font for 7th sector. Add a yellow
    ' (0xFFFF00) background box with a black (0x000000) edge.
    Call c.sector(6).setLabelStyle("timesbi.ttf", 8, &H008000).setBackground(&Hffff00, &H000000)

    ' Output the chart
    Set viewer.Picture = c.makePicture()

    'include tool tip for the chart
    viewer.ImageMap = c.getHTMLImageMap("clickable", "", _
        "title='{label}: US${value}K ({percent}%)'")

End Sub
© 2021 Advanced Software Engineering Limited. All rights reserved.