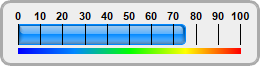
This example demonstrates the basic steps in creating a horizontal bar meter.
A horizontal bar meter can be created using the following steps:
- Create a LinearMeter object using LinearMeter.LinearMeter, optionally specify the background and border colors and whether to use rounded and/or thick frames..
- Specify the size of the meter scale and the orientation of the scale labels using LinearMeter.setMeter. In this example, the scale labels are positioned at the top of the meter scale. This automatically implies the meter as horizontal.
- Set the numeric scale of the meter using BaseMeter.setScale.
- Optionally add a color scale to the meter using BaseMeter.addColorScale. Whereas the meter scale displays the values with text labels, a color scale represents the values with different colors.
- Add a bar to the meter using LinearMeter.addBar. In this example, the bar is added with a glass shading effect specified using ChartDirector.API.glassEffect.
[Web Version (in ASP)] aspdemo\hbarmeter.asp
<%@ language="vbscript" %>
<%
Set cd = CreateObject("ChartDirector.API")

' The value to display on the meter
value = 75.35

' Create an LinearMeter object of size 260 x 66 pixels with a very light grey (0xeeeeee) background,
' and a rounded 3-pixel thick light grey (0xaaaaaa) border
Set m = cd.LinearMeter(260, 66, &Heeeeee, &Haaaaaa)
Call m.setRoundedFrame(cd.Transparent)
Call m.setThickFrame(3)

' Set the scale region top-left corner at (18, 24), with size of 222 x 20 pixels. The scale labels
' are located on the top (implies horizontal meter)
Call m.setMeter(18, 24, 222, 20, cd.Top)

' Set meter scale from 0 - 100, with a tick every 10 units
Call m.setScale(0, 100, 10)

' Add a 5-pixel thick smooth color scale to the meter at y = 48 (below the meter scale)
smoothColorScale = Array(0, &H0000ff, 25, &H0088ff, 50, &H00ff00, 75, &Hffff00, 100, &Hff0000)
Call m.addColorScale(smoothColorScale, 48, 5)

' Add a light blue (0x0088ff) bar from 0 to the data value with glass effect and 4 pixel rounded
' corners
Call m.addBar(0, value, &H0088ff, cd.glassEffect(cd.NormalGlare, cd.Top), 4)

' Output the chart
Set viewer = cd.WebChartViewer(Request, "chart1")
Call viewer.setChart(m, cd.SVG)
%>

<!DOCTYPE html>
<html>
<head>
    <title>Horizontal Bar Meter</title>
    <!-- Include ChartDirector Javascript Library to support chart interactions -->
    <script type="text/javascript" src="cdjcv.js"></script>
</head>
<body style="margin:5px 0px 0px 5px">
    <div style="font:bold 18pt verdana;">
        Horizontal Bar Meter
    </div>
    <hr style="border:solid 1px #000080; background:#000080" />
    <div style="font:10pt verdana; margin-bottom:1.5em">
        <a href="viewsource.asp?file=<%= Request("SCRIPT_NAME") %>">View Chart Source Code</a>
    </div>
    <!-- ****** Here is the chart image ****** -->
    <%= viewer.renderHTML() %>
</body>
</html>
[Windows Version (in Visual Basic)] vbdemo\hbarmeter.cls
Public Sub createChart(viewer As Object, chartIndex As Integer)

    Dim cd As New ChartDirector.API

    ' The value to display on the meter
    Dim value As Double
    value = 75.35

    ' Create an LinearMeter object of size 260 x 66 pixels with a very light grey (0xeeeeee)
    ' background, and a rounded 3-pixel thick light grey (0xaaaaaa) border
    Dim m As LinearMeter
    Set m = cd.LinearMeter(260, 66, &Heeeeee, &Haaaaaa)
    Call m.setRoundedFrame()
    Call m.setThickFrame(3)

    ' Set the scale region top-left corner at (18, 24), with size of 222 x 20 pixels. The scale
    ' labels are located on the top (implies horizontal meter)
    Call m.setMeter(18, 24, 222, 20, cd.Top)

    ' Set meter scale from 0 - 100, with a tick every 10 units
    Call m.setScale(0, 100, 10)

    ' Add a 5-pixel thick smooth color scale to the meter at y = 48 (below the meter scale)
    Dim smoothColorScale()
    smoothColorScale = Array(0, &H0000ff, 25, &H0088ff, 50, &H00ff00, 75, &Hffff00, 100, &Hff0000)
    Call m.addColorScale(smoothColorScale, 48, 5)

    ' Add a light blue (0x0088ff) bar from 0 to the data value with glass effect and 4 pixel rounded
    ' corners
    Call m.addBar(0, value, &H0088ff, cd.glassEffect(cd.NormalGlare, cd.Top), 4)

    ' Output the chart
    Set viewer.Picture = m.makePicture()

End Sub
© 2021 Advanced Software Engineering Limited. All rights reserved.