[Web Version (in ASP)] aspdemo\hbarmeterorientation.asp
<%@ language="vbscript" %>
<%
Set cd = CreateObject("ChartDirector.API")
' This script can draw different charts depending on the chartIndex
Sub createChart(viewer, chartIndex)
' The value to display on the meter
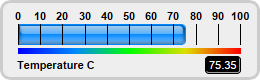
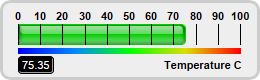
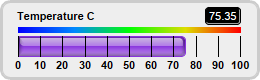
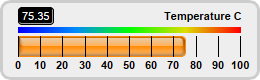
value = 75.35
' The bar colors for the meters
barColor = Array(&H0088ff, &H00cc00, &H8833dd, &Hff8800)
' Create a LinearMeter object of size 260 x 80 pixels with very light grey (0xeeeeee) backgruond
' and a light grey (0xccccccc) 3-pixel thick rounded frame
Set m = cd.LinearMeter(260, 80, &Heeeeee, &Hcccccc)
Call m.setRoundedFrame(cd.Transparent)
Call m.setThickFrame(3)
' This example demonstrates putting the text labels at the top or bottom. This is by setting the
' label alignment, as well as the scale, color scale and label positions.
alignment = Array(cd.Top, cd.Top, cd.Bottom, cd.Bottom)
meterYPos = Array(24, 24, 36, 36)
labelYPos = Array(65, 65, 16, 16)
colorScalePos = Array(48, 48, 27, 27)
' Set the scale region
Call m.setMeter(18, meterYPos(chartIndex), 222, 20, alignment(chartIndex))
' Set meter scale from 0 - 100, with a tick every 10 units
Call m.setScale(0, 100, 10)
' Add a 5-pixel thick smooth color scale
smoothColorScale = Array(0, &H0000ff, 25, &H0088ff, 50, &H00ff00, 75, &Hdddd00, 100, &Hff0000)
Call m.addColorScale(smoothColorScale, colorScalePos(chartIndex), 5)
' Add a bar from 0 to value with glass effect and 4 pixel rounded corners
Call m.addBar(0, value, barColor(chartIndex), cd.glassEffect(cd.NormalGlare, cd.Top), 4)
'
' In this example, some charts have the "Temperauture" label on the left side and the value
' readout on the right side, and some charts have the reverse
'
If chartIndex Mod 2 = 0 Then
' Add a label on the left side using 8pt Arial Bold font
Call m.addText(15, labelYPos(chartIndex), "Temperature C", "Arial Bold", 8, cd.TextColor, _
cd.Left)
' Add a text box on the right side. Display the value using white (0xffffff) 8pt Arial Bold
' font on a black (0x000000) background with depressed rounded border.
Set t = m.addText(240, labelYPos(chartIndex), m.formatValue(value, "2"), "Arial", 8, _
&Hffffff, cd.Right)
Call t.setBackground(&H000000, &H000000, -1)
Call t.setRoundedCorners(3)
Else
' Add a label on the right side using 8pt Arial Bold font
Call m.addText(243, labelYPos(chartIndex), "Temperature C", "Arial Bold", 8, cd.TextColor, _
cd.Right)
' Add a text box on the left side. Display the value using white (0xffffff) 8pt Arial Bold
' font on a black (0x000000) background with depressed rounded border.
Set t = m.addText(18, labelYPos(chartIndex), m.formatValue(value, "2"), "Arial", 8, _
&Hffffff, cd.Left)
Call t.setBackground(&H000000, &H000000, -1)
Call t.setRoundedCorners(3)
End If
' Output the chart
Call viewer.setChart(m, cd.SVG)
End Sub
' This example includes 4 charts
Dim viewers(3)
For i = 0 To Ubound(viewers)
Set viewers(i) = cd.WebChartViewer(Request, "chart" & i)
Call createChart(viewers(i), i)
Next
%>
<!DOCTYPE html>
<html>
<head>
<title>H-Bar Meter Orientation</title>
<!-- Include ChartDirector Javascript Library to support chart interactions -->
<script type="text/javascript" src="cdjcv.js"></script>
</head>
<body style="margin:5px 0px 0px 5px">
<div style="font:bold 18pt verdana;">
H-Bar Meter Orientation
</div>
<hr style="border:solid 1px #000080; background:#000080" />
<div style="font:10pt verdana; margin-bottom:1.5em">
<a href="viewsource.asp?file=<%= Request("SCRIPT_NAME") %>">View Chart Source Code</a>
</div>
<!-- ****** Here are the chart images ****** -->
<%
For i = 0 To Ubound(viewers)
Call Response.Write(viewers(i).renderHTML())
Call Response.Write(" ")
Next
%>
</body>
</html>
[Windows Version (in Visual Basic)] vbdemo\hbarmeterorientation.cls
Public Sub createChart(viewer As Object, chartIndex As Integer)

    Dim cd As New ChartDirector.API

    ' The value to display on the meter
    Dim value As Double
    value = 75.35

    ' The bar colors for the meters
    Dim barColor()
    barColor = Array(&H0088ff, &H00cc00, &H8833dd, &Hff8800)

    ' Create a LinearMeter object of size 260 x 80 pixels with very light grey (0xeeeeee) backgruond
    ' and a light grey (0xccccccc) 3-pixel thick rounded frame
    Dim m As LinearMeter
    Set m = cd.LinearMeter(260, 80, &Heeeeee, &Hcccccc)
    Call m.setRoundedFrame()
    Call m.setThickFrame(3)

    ' This example demonstrates putting the text labels at the top or bottom. This is by setting the
    ' label alignment, as well as the scale, color scale and label positions.
    Dim alignment()
    alignment = Array(cd.Top, cd.Top, cd.Bottom, cd.Bottom)
    Dim meterYPos()
    meterYPos = Array(24, 24, 36, 36)
    Dim labelYPos()
    labelYPos = Array(65, 65, 16, 16)
    Dim colorScalePos()
    colorScalePos = Array(48, 48, 27, 27)

    ' Set the scale region
    Call m.setMeter(18, meterYPos(chartIndex), 222, 20, alignment(chartIndex))

    ' Set meter scale from 0 - 100, with a tick every 10 units
    Call m.setScale(0, 100, 10)

    ' Add a 5-pixel thick smooth color scale
    Dim smoothColorScale()
    smoothColorScale = Array(0, &H0000ff, 25, &H0088ff, 50, &H00ff00, 75, &Hdddd00, 100, &Hff0000)
    Call m.addColorScale(smoothColorScale, colorScalePos(chartIndex), 5)

    ' Add a bar from 0 to value with glass effect and 4 pixel rounded corners
    Call m.addBar(0, value, barColor(chartIndex), cd.glassEffect(cd.NormalGlare, cd.Top), 4)

    '
    ' In this example, some charts have the "Temperauture" label on the left side and the value
    ' readout on the right side, and some charts have the reverse
    '

    If chartIndex Mod 2 = 0 Then
        ' Add a label on the left side using 8pt Arial Bold font
        Call m.addText(15, labelYPos(chartIndex), "Temperature C", "arialbd.ttf", 8, cd.TextColor, _
            cd.Left)

        ' Add a text box on the right side. Display the value using white (0xffffff) 8pt Arial Bold
        ' font on a black (0x000000) background with depressed rounded border.
        Dim t As ChartDirector.TextBox
        Set t = m.addText(240, labelYPos(chartIndex), m.formatValue(value, "2"), "arial.ttf", 8, _
            &Hffffff, cd.Right)
        Call t.setBackground(&H000000, &H000000, -1)
        Call t.setRoundedCorners(3)
    Else
        ' Add a label on the right side using 8pt Arial Bold font
        Call m.addText(243, labelYPos(chartIndex), "Temperature C", "arialbd.ttf", 8, _
            cd.TextColor, cd.Right)

        ' Add a text box on the left side. Display the value using white (0xffffff) 8pt Arial Bold
        ' font on a black (0x000000) background with depressed rounded border.
        Set t = m.addText(18, labelYPos(chartIndex), m.formatValue(value, "2"), "arial.ttf", 8, _
            &Hffffff, cd.Left)
        Call t.setBackground(&H000000, &H000000, -1)
        Call t.setRoundedCorners(3)
    End If

    ' Output the chart
    Set viewer.Picture = m.makePicture()

End Sub
© 2021 Advanced Software Engineering Limited. All rights reserved.