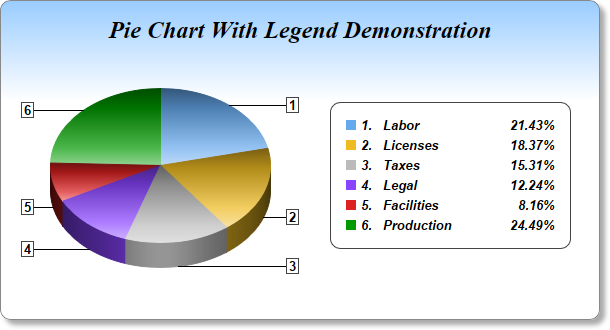
This example demonstrates a pie chart with a legend box, together with many effects, such as gradient color background, rounded frame, soft drop shadow, custom sector colors, sector gradient shading, customized sector labels and using
CDML and
Parameter Substitution and Formatting to format legend text.
- The gradient background is achieved by using BaseChart.linearGradientColor to define the gradient color, then use BaseChart.setBackground to set it as the chart background color.
- The rounded frame is configured using BaseChart.setRoundedFrame.
- The soft drop shadow is configured using BaseChart.setDropShadow.
- The sector colors are set using BaseChart.setColors. The sector gradient shading is configured using PieChart.setSectorStyle.
- The sector labels are configured using PieChart.setLabelFormat to show the sector number. PieChart.setLabelStyle is used to set the label style. It returns a TextBox object representing the sector label prototype. The Box.setBackground method of the label prototype is then used to add black borders around the labels.
- The legend text is configured by calling the TextBox.setText method of the LegendBox object. The legend text template is specified using CDML and Parameter Substitution and Formatting as follows:
<*block,valign=top*>{={sector}+1}.<*advanceTo=22*><*block,width=120*>{label}<*/*><*block,width=40,halign=right*>{percent}<*/*>%
The starting "<*block,valign=top*>" means the different parts in the legend entry should be aligned to the top. This is necessarily because the second part of the legend entry (described below) can have multiple lines.
The first part of the legend entry is "{={sector}+1}.<*advanceTo=22*>", which means the show the sector number, then "tab" to the 22th pixel position. (In ChartDirector, the sector number starts from 0. So we add 1 to {sector} to make the displayed sector number to start from 1.)
The second part "<*block,width=120*>{label}<*/*>" which means to show the sector label in a 120 pixels block. If the label is wider than 120 pixels, it will be wrapped into multiple lines within the block.
The last part "<*block,width=40,halign=right*>{percent}<*/*>%" means to show the percentage in a 40 pixels block, with the contents right aligned.
[Web Version (in ASP)] aspdemo\legendpie2.asp
<%@ language="vbscript" %>
<%
Set cd = CreateObject("ChartDirector.API")

' The data for the pie chart
data = Array(21, 18, 15, 12, 8, 24)

' The labels for the pie chart
labels = Array("Labor", "Licenses", "Taxes", "Legal", "Facilities", "Production")

' The colors to use for the sectors
colors = Array(&H66aaee, &Heebb22, &Hbbbbbb, &H8844ff, &Hdd2222, &H009900)

' Create a PieChart object of size 600 x 320 pixels. Use a vertical gradient color from light blue
' (99ccff) to white (ffffff) spanning the top 100 pixels as background. Set border to grey (888888).
' Use rounded corners. Enable soft drop shadow.
Set c = cd.PieChart(600, 320)
Call c.setBackground(c.linearGradientColor(0, 0, 0, 100, &H99ccff, &Hffffff), &H888888)
Call c.setRoundedFrame()
Call c.setDropShadow()

' Add a title using 18pt Times New Roman Bold Italic font. Add 16 pixels top margin to the title.
Call c.addTitle("Pie Chart With Legend Demonstration", "Times New Roman Bold Italic", 18 _
    ).setMargin2(0, 0, 16, 0)

' Set the center of the pie at (160, 165) and the radius to 110 pixels
Call c.setPieSize(160, 165, 110)

' Draw the pie in 3D with a pie thickness of 25 pixels
Call c.set3D(25)

' Set the pie data and the pie labels
Call c.setData(data, labels)

' Set the sector colors
Call c.setColors2(cd.DataColor, colors)

' Use local gradient shading for the sectors
Call c.setSectorStyle(cd.LocalGradientShading)

' Use the side label layout method, with the labels positioned 16 pixels from the pie bounding box
Call c.setLabelLayout(cd.SideLayout, 16)

' Show only the sector number as the sector label
Call c.setLabelFormat("{={sector}+1}")

' Set the sector label style to Arial Bold 10pt, with a dark grey (444444) border
Call c.setLabelStyle("Arial Bold", 10).setBackground(cd.Transparent, &H444444)

' Add a legend box, with the center of the left side anchored at (330, 175), and using 10pt Arial
' Bold Italic font
Set b = c.addLegend(330, 175, True, "Arial Bold Italic", 10)
Call b.setAlignment(cd.Left)

' Set the legend box border to dark grey (444444), and with rounded conerns
Call b.setBackground(cd.Transparent, &H444444)
Call b.setRoundedCorners()

' Set the legend box margin to 16 pixels, and the extra line spacing between the legend entries as 5
' pixels
Call b.setMargin(16)
Call b.setKeySpacing(0, 5)

' Set the legend box icon to have no border (border color same as fill color)
Call b.setKeyBorder(cd.SameAsMainColor)

' Set the legend text to show the sector number, followed by a 120 pixels wide block showing the
' sector label, and a 40 pixels wide block showing the percentage
Call b.setText( _
    "<*block,valign=top*>{={sector}+1}.<*advanceTo=22*><*block,width=120*>{label}<*/*>" & _
    "<*block,width=40,halign=right*>{percent}<*/*>%")

' Output the chart
Set viewer = cd.WebChartViewer(Request, "chart1")
Call viewer.setChart(c, cd.SVG)

' Include tool tip for the chart
viewer.ImageMap = c.getHTMLImageMap("", "", "title='{label}: US${value}K ({percent}%)'")
%>

<!DOCTYPE html>
<html>
<head>
    <title>Pie Chart with Legend (2)</title>
    <!-- Include ChartDirector Javascript Library to support chart interactions -->
    <script type="text/javascript" src="cdjcv.js"></script>
</head>
<body style="margin:5px 0px 0px 5px">
    <div style="font:bold 18pt verdana;">
        Pie Chart with Legend (2)
    </div>
    <hr style="border:solid 1px #000080; background:#000080" />
    <div style="font:10pt verdana; margin-bottom:1.5em">
        <a href="viewsource.asp?file=<%= Request("SCRIPT_NAME") %>">View Chart Source Code</a>
    </div>
    <!-- ****** Here is the chart image ****** -->
    <%= viewer.renderHTML() %>
</body>
</html>
[Windows Version (in Visual Basic)] vbdemo\legendpie2.cls
Public Sub createChart(viewer As Object, chartIndex As Integer)

    Dim cd As New ChartDirector.API

    ' The data for the pie chart
    Dim data()
    data = Array(21, 18, 15, 12, 8, 24)

    ' The labels for the pie chart
    Dim labels()
    labels = Array("Labor", "Licenses", "Taxes", "Legal", "Facilities", "Production")

    ' The colors to use for the sectors
    Dim colors()
    colors = Array(&H66aaee, &Heebb22, &Hbbbbbb, &H8844ff, &Hdd2222, &H009900)

    ' Create a PieChart object of size 600 x 320 pixels. Use a vertical gradient color from light
    ' blue (99ccff) to white (ffffff) spanning the top 100 pixels as background. Set border to grey
    ' (888888). Use rounded corners. Enable soft drop shadow.
    Dim c As PieChart
    Set c = cd.PieChart(600, 320)
    Call c.setBackground(c.linearGradientColor(0, 0, 0, 100, &H99ccff, &Hffffff), &H888888)
    Call c.setRoundedFrame()
    Call c.setDropShadow()

    ' Add a title using 18pt Times New Roman Bold Italic font. Add 16 pixels top margin to the
    ' title.
    Call c.addTitle("Pie Chart With Legend Demonstration", "timesbi.ttf", 18).setMargin2(0, 0, 16,0)

    ' Set the center of the pie at (160, 165) and the radius to 110 pixels
    Call c.setPieSize(160, 165, 110)

    ' Draw the pie in 3D with a pie thickness of 25 pixels
    Call c.set3D(25)

    ' Set the pie data and the pie labels
    Call c.setData(data, labels)

    ' Set the sector colors
    Call c.setColors2(cd.DataColor, colors)

    ' Use local gradient shading for the sectors
    Call c.setSectorStyle(cd.LocalGradientShading)

    ' Use the side label layout method, with the labels positioned 16 pixels from the pie bounding
    ' box
    Call c.setLabelLayout(cd.SideLayout, 16)

    ' Show only the sector number as the sector label
    Call c.setLabelFormat("{={sector}+1}")

    ' Set the sector label style to Arial Bold 10pt, with a dark grey (444444) border
    Call c.setLabelStyle("arialbd.ttf", 10).setBackground(cd.Transparent, &H444444)

    ' Add a legend box, with the center of the left side anchored at (330, 175), and using 10pt
    ' Arial Bold Italic font
    Dim b As LegendBox
    Set b = c.addLegend(330, 175, True, "arialbi.ttf", 10)
    Call b.setAlignment(cd.Left)

    ' Set the legend box border to dark grey (444444), and with rounded conerns
    Call b.setBackground(cd.Transparent, &H444444)
    Call b.setRoundedCorners()

    ' Set the legend box margin to 16 pixels, and the extra line spacing between the legend entries
    ' as 5 pixels
    Call b.setMargin(16)
    Call b.setKeySpacing(0, 5)

    ' Set the legend box icon to have no border (border color same as fill color)
    Call b.setKeyBorder(cd.SameAsMainColor)

    ' Set the legend text to show the sector number, followed by a 120 pixels wide block showing the
    ' sector label, and a 40 pixels wide block showing the percentage
    Call b.setText( _
        "<*block,valign=top*>{={sector}+1}.<*advanceTo=22*><*block,width=120*>{label}<*/*>" & _
        "<*block,width=40,halign=right*>{percent}<*/*>%")

    ' Output the chart
    Set viewer.Picture = c.makePicture()

    'include tool tip for the chart
    viewer.ImageMap = c.getHTMLImageMap("clickable", "", _
        "title='{label}: US${value}K ({percent}%)'")

End Sub
© 2021 Advanced Software Engineering Limited. All rights reserved.