[Web Version (in ASP)] aspdemo\multicylinder.asp
<%@ language="vbscript" %>
<%
Set cd = CreateObject("ChartDirector.API")
' Data for the chart
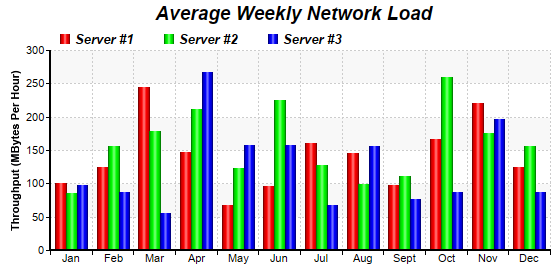
data0 = Array(100, 125, 245, 147, 67, 96, 160, 145, 97, 167, 220, 125)
data1 = Array(85, 156, 179, 211, 123, 225, 127, 99, 111, 260, 175, 156)
data2 = Array(97, 87, 56, 267, 157, 157, 67, 156, 77, 87, 197, 87)
labels = Array("Jan", "Feb", "Mar", "Apr", "May", "Jun", "Jul", "Aug", "Sept", "Oct", "Nov", "Dec")
' Create a XYChart object of size 560 x 280 pixels.
Set c = cd.XYChart(560, 280)
' Add a title to the chart using 14pt Arial Bold Italic font
Call c.addTitle(" Average Weekly Network Load", "Arial Bold Italic", 14)
' Set the plotarea at (50, 50) and of 500 x 200 pixels in size. Use alternating light grey (f8f8f8)
' / white (ffffff) background. Set border to transparent and use grey (CCCCCC) dotted lines as
' horizontal and vertical grid lines
Call c.setPlotArea(50, 50, 500, 200, &Hffffff, &Hf8f8f8, cd.Transparent, c.dashLineColor(&Hcccccc, _
cd.DotLine), c.dashLineColor(&Hcccccc, cd.DotLine))
' Add a legend box at (50, 22) using horizontal layout. Use 10 pt Arial Bold Italic font, with
' transparent background
Call c.addLegend(50, 22, False, "Arial Bold Italic", 10).setBackground(cd.Transparent)
' Set the x axis labels
Call c.xAxis().setLabels(labels)
' Draw the ticks between label positions (instead of at label positions)
Call c.xAxis().setTickOffset(0.5)
' Add axis title
Call c.yAxis().setTitle("Throughput (MBytes Per Hour)")
' Set axis line width to 2 pixels
Call c.xAxis().setWidth(2)
Call c.yAxis().setWidth(2)
' Add a multi-bar layer with 3 data sets
Set layer = c.addBarLayer2(cd.Side)
Call layer.addDataSet(data0, &Hff0000, "Server #1")
Call layer.addDataSet(data1, &H00ff00, "Server #2")
Call layer.addDataSet(data2, &H0000ff, "Server #3")
' Set bar shape to circular (cylinder)
Call layer.setBarShape(cd.CircleShape)
' Configure the bars within a group to touch each others (no gap)
Call layer.setBarGap(0.2, cd.TouchBar)
' Output the chart
Set viewer = cd.WebChartViewer(Request, "chart1")
Call viewer.setChart(c, cd.SVG)
' Include tool tip for the chart
viewer.ImageMap = c.getHTMLImageMap("", "", _
"title='{dataSetName} on {xLabel}: {value} MBytes/hour'")
%>
<!DOCTYPE html>
<html>
<head>
<title>Multi-Cylinder Chart</title>
<!-- Include ChartDirector Javascript Library to support chart interactions -->
<script type="text/javascript" src="cdjcv.js"></script>
</head>
<body style="margin:5px 0px 0px 5px">
<div style="font:bold 18pt verdana;">
Multi-Cylinder Chart
</div>
<hr style="border:solid 1px #000080; background:#000080" />
<div style="font:10pt verdana; margin-bottom:1.5em">
<a href="viewsource.asp?file=<%= Request("SCRIPT_NAME") %>">View Chart Source Code</a>
</div>
<!-- ****** Here is the chart image ****** -->
<%= viewer.renderHTML() %>
</body>
</html>
[Windows Version (in Visual Basic)] vbdemo\multicylinder.cls
Public Sub createChart(viewer As Object, chartIndex As Integer)

    Dim cd As New ChartDirector.API

    ' Data for the chart
    Dim data0()
    data0 = Array(100, 125, 245, 147, 67, 96, 160, 145, 97, 167, 220, 125)
    Dim data1()
    data1 = Array(85, 156, 179, 211, 123, 225, 127, 99, 111, 260, 175, 156)
    Dim data2()
    data2 = Array(97, 87, 56, 267, 157, 157, 67, 156, 77, 87, 197, 87)
    Dim labels()
    labels = Array("Jan", "Feb", "Mar", "Apr", "May", "Jun", "Jul", "Aug", "Sept", "Oct", "Nov", _
        "Dec")

    ' Create a XYChart object of size 560 x 280 pixels.
    Dim c As XYChart
    Set c = cd.XYChart(560, 280)

    ' Add a title to the chart using 14pt Arial Bold Italic font
    Call c.addTitle("     Average Weekly Network Load", "arialbi.ttf", 14)

    ' Set the plotarea at (50, 50) and of 500 x 200 pixels in size. Use alternating light grey
    ' (f8f8f8) / white (ffffff) background. Set border to transparent and use grey (CCCCCC) dotted
    ' lines as horizontal and vertical grid lines
    Call c.setPlotArea(50, 50, 500, 200, &Hffffff, &Hf8f8f8, cd.Transparent, c.dashLineColor( _
        &Hcccccc, cd.DotLine), c.dashLineColor(&Hcccccc, cd.DotLine))

    ' Add a legend box at (50, 22) using horizontal layout. Use 10 pt Arial Bold Italic font, with
    ' transparent background
    Call c.addLegend(50, 22, False, "arialbi.ttf", 10).setBackground(cd.Transparent)

    ' Set the x axis labels
    Call c.xAxis().setLabels(labels)

    ' Draw the ticks between label positions (instead of at label positions)
    Call c.xAxis().setTickOffset(0.5)

    ' Add axis title
    Call c.yAxis().setTitle("Throughput (MBytes Per Hour)")

    ' Set axis line width to 2 pixels
    Call c.xAxis().setWidth(2)
    Call c.yAxis().setWidth(2)

    ' Add a multi-bar layer with 3 data sets
    Dim layer As BarLayer
    Set layer = c.addBarLayer2(cd.Side)
    Call layer.addDataSet(data0, &Hff0000, "Server #1")
    Call layer.addDataSet(data1, &H00ff00, "Server #2")
    Call layer.addDataSet(data2, &H0000ff, "Server #3")

    ' Set bar shape to circular (cylinder)
    Call layer.setBarShape(cd.CircleShape)

    ' Configure the bars within a group to touch each others (no gap)
    Call layer.setBarGap(0.2, cd.TouchBar)

    ' Output the chart
    Set viewer.Picture = c.makePicture()

    'include tool tip for the chart
    viewer.ImageMap = c.getHTMLImageMap("clickable", "", _
        "title='{dataSetName} on {xLabel}: {value} MBytes/hour'")

End Sub
© 2021 Advanced Software Engineering Limited. All rights reserved.