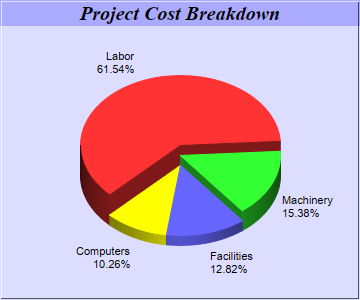
This example demonstrates a 3D pie chart where sectors have different 3D heights.
Instead of using
PieChart.set3D to set a single 3D depth for all sectors, in this example,
PieChart.set3D2 is used to set different depths for the sectors with an array of integers.
[Web Version (in ASP)] aspdemo\multidepthpie.asp
<%@ language="vbscript" %>
<%
Set cd = CreateObject("ChartDirector.API")

' The data for the pie chart
data = Array(72, 18, 15, 12)

' The labels for the pie chart
labels = Array("Labor", "Machinery", "Facilities", "Computers")

' The depths for the sectors
depths = Array(30, 20, 10, 10)

' Create a PieChart object of size 360 x 300 pixels, with a light blue (DDDDFF) background and a 1
' pixel 3D border
Set c = cd.PieChart(360, 300, &Hddddff, -1, 1)

' Set the center of the pie at (180, 175) and the radius to 100 pixels
Call c.setPieSize(180, 175, 100)

' Add a title box using 15pt Times Bold Italic font and blue (AAAAFF) as background color
Call c.addTitle("Project Cost Breakdown", "Times New Roman Bold Italic", 15).setBackground( _
    &Haaaaff)

' Set the pie data and the pie labels
Call c.setData(data, labels)

' Draw the pie in 3D with variable 3D depths
Call c.set3D2(depths)

' Set the start angle to 225 degrees may improve layout when the depths of the sector are sorted in
' descending order, because it ensures the tallest sector is at the back.
Call c.setStartAngle(225)

' Output the chart
Set viewer = cd.WebChartViewer(Request, "chart1")
Call viewer.setChart(c, cd.SVG)

' Include tool tip for the chart
viewer.ImageMap = c.getHTMLImageMap("", "", "title='{label}: US${value}K ({percent}%)'")
%>

<!DOCTYPE html>
<html>
<head>
    <title>Multi-Depth Pie Chart</title>
    <!-- Include ChartDirector Javascript Library to support chart interactions -->
    <script type="text/javascript" src="cdjcv.js"></script>
</head>
<body style="margin:5px 0px 0px 5px">
    <div style="font:bold 18pt verdana;">
        Multi-Depth Pie Chart
    </div>
    <hr style="border:solid 1px #000080; background:#000080" />
    <div style="font:10pt verdana; margin-bottom:1.5em">
        <a href="viewsource.asp?file=<%= Request("SCRIPT_NAME") %>">View Chart Source Code</a>
    </div>
    <!-- ****** Here is the chart image ****** -->
    <%= viewer.renderHTML() %>
</body>
</html>
[Windows Version (in Visual Basic)] vbdemo\multidepthpie.cls
Public Sub createChart(viewer As Object, chartIndex As Integer)

    Dim cd As New ChartDirector.API

    ' The data for the pie chart
    Dim data()
    data = Array(72, 18, 15, 12)

    ' The labels for the pie chart
    Dim labels()
    labels = Array("Labor", "Machinery", "Facilities", "Computers")

    ' The depths for the sectors
    Dim depths()
    depths = Array(30, 20, 10, 10)

    ' Create a PieChart object of size 360 x 300 pixels, with a light blue (DDDDFF) background and a
    ' 1 pixel 3D border
    Dim c As PieChart
    Set c = cd.PieChart(360, 300, &Hddddff, -1, 1)

    ' Set the center of the pie at (180, 175) and the radius to 100 pixels
    Call c.setPieSize(180, 175, 100)

    ' Add a title box using 15pt Times Bold Italic font and blue (AAAAFF) as background color
    Call c.addTitle("Project Cost Breakdown", "timesbi.ttf", 15).setBackground(&Haaaaff)

    ' Set the pie data and the pie labels
    Call c.setData(data, labels)

    ' Draw the pie in 3D with variable 3D depths
    Call c.set3D2(depths)

    ' Set the start angle to 225 degrees may improve layout when the depths of the sector are sorted
    ' in descending order, because it ensures the tallest sector is at the back.
    Call c.setStartAngle(225)

    ' Output the chart
    Set viewer.Picture = c.makePicture()

    'include tool tip for the chart
    viewer.ImageMap = c.getHTMLImageMap("clickable", "", _
        "title='{label}: US${value}K ({percent}%)'")

End Sub
© 2021 Advanced Software Engineering Limited. All rights reserved.