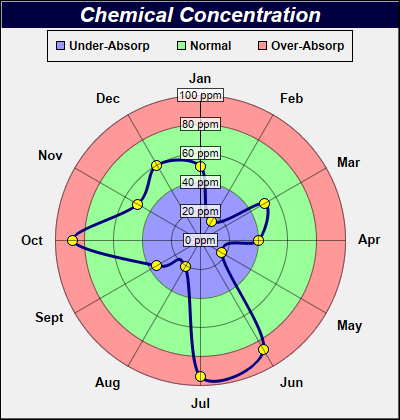
This example demonstrates adding circular zones to a polar chart.
In ChartDirector, a zone defined on the radial axis will mark a radius range, and so will appear as ring on a polar chart.
This example contains three circular zones in the plot area background, colored as red, green and blue. The blue region is the original background of the plot area, while the red and green regions are added using
Axis.addZone of the radial axis object.
[Web Version (in ASP)] aspdemo\polarzones.asp
<%@ language="vbscript" %>
<%
Set cd = CreateObject("ChartDirector.API")

' The data for the chart
data = Array(51, 15, 51, 40, 17, 87, 94, 21, 35, 88, 50, 60)

' The labels for the chart
labels = Array("Jan", "Feb", "Mar", "Apr", "May", "Jun", "Jul", "Aug", "Sept", "Oct", "Nov", "Dec")

' Create a PolarChart object of size 400 x 420 pixels
Set c = cd.PolarChart(400, 420)

' Set background color to a pale grey f0f0f0, with a black border and 1 pixel 3D border effect
Call c.setBackground(&Hf0f0f0, &H000000, 1)

' Add a title to the chart using 16pt Arial Bold Italic font. The title text is white (0xffffff) on
' a dark blue (000040) background
Call c.addTitle("Chemical Concentration", "Arial Bold Italic", 16, &Hffffff).setBackground( _
    &H000040)

' Set center of plot area at (200, 240) with radius 145 pixels. Set background color to blue
' (9999ff)
Call c.setPlotArea(200, 240, 145, &H9999ff)

' Color the region between radius = 40 to 80 as green (99ff99)
Call c.radialAxis().addZone(40, 80, &H99ff99)

' Color the region with radius > 80 as red (ff9999)
Call c.radialAxis().addZone(80, 999, &Hff9999)

' Set the grid style to circular grid
Call c.setGridStyle(False)

' Set the radial axis label format
Call c.radialAxis().setLabelFormat("{value} ppm")

' Use semi-transparent (40ffffff) label background so as not to block the data
Call c.radialAxis().setLabelStyle().setBackground(&H40ffffff, &H40000000)

' Add a legend box at (200, 30) top center aligned, using 9pt Arial Bold font. with a black border.
Set legendBox = c.addLegend(200, 30, False, "Arial Bold", 9)
Call legendBox.setAlignment(cd.TopCenter)

' Add legend keys to represent the red/green/blue zones
Call legendBox.addKey("Under-Absorp", &H9999ff)
Call legendBox.addKey("Normal", &H99ff99)
Call legendBox.addKey("Over-Absorp", &Hff9999)

' Add a blue (000080) spline line layer with line width set to 3 pixels and using yellow (ffff00)
' circles to represent the data points
Set layer = c.addSplineLineLayer(data, &H000080)
Call layer.setLineWidth(3)
Call layer.setDataSymbol(cd.CircleShape, 11, &Hffff00)

' Set the labels to the angular axis as spokes.
Call c.angularAxis().setLabels(labels)

' Output the chart
Set viewer = cd.WebChartViewer(Request, "chart1")
Call viewer.setChart(c, cd.SVG)

' Include tool tip for the chart.
viewer.ImageMap = layer.getHTMLImageMap("", "", "title='Concentration on {label}: {value} ppm'")
%>

<!DOCTYPE html>
<html>
<head>
    <title>Circular Zones</title>
    <!-- Include ChartDirector Javascript Library to support chart interactions -->
    <script type="text/javascript" src="cdjcv.js"></script>
</head>
<body style="margin:5px 0px 0px 5px">
    <div style="font:bold 18pt verdana;">
        Circular Zones
    </div>
    <hr style="border:solid 1px #000080; background:#000080" />
    <div style="font:10pt verdana; margin-bottom:1.5em">
        <a href="viewsource.asp?file=<%= Request("SCRIPT_NAME") %>">View Chart Source Code</a>
    </div>
    <!-- ****** Here is the chart image ****** -->
    <%= viewer.renderHTML() %>
</body>
</html>
[Windows Version (in Visual Basic)] vbdemo\polarzones.cls
Public Sub createChart(viewer As Object, chartIndex As Integer)

    Dim cd As New ChartDirector.API

    ' The data for the chart
    Dim data()
    data = Array(51, 15, 51, 40, 17, 87, 94, 21, 35, 88, 50, 60)

    ' The labels for the chart
    Dim labels()
    labels = Array("Jan", "Feb", "Mar", "Apr", "May", "Jun", "Jul", "Aug", "Sept", "Oct", "Nov", _
        "Dec")

    ' Create a PolarChart object of size 400 x 420 pixels
    Dim c As PolarChart
    Set c = cd.PolarChart(400, 420)

    ' Set background color to a 2 pixel pattern color, with a black border and 1 pixel 3D border
    ' effect
    Call c.setBackground(c.patternColor(Array(&Hffffff, &He0e0e0), 2), 0, 1)

    ' Add a title to the chart using 16pt Arial Bold Italic font. The title text is white (0xffffff)
    ' on 2 pixel pattern background
    Call c.addTitle("Chemical Concentration", "arialbi.ttf", 16, &Hffffff).setBackground( _
        c.patternColor(Array(&H000000, &H000080), 2))

    ' Set center of plot area at (200, 240) with radius 145 pixels. Set background color to blue
    ' (9999ff)
    Call c.setPlotArea(200, 240, 145, &H9999ff)

    ' Color the region between radius = 40 to 80 as green (99ff99)
    Call c.radialAxis().addZone(40, 80, &H99ff99)

    ' Color the region with radius > 80 as red (ff9999)
    Call c.radialAxis().addZone(80, 999, &Hff9999)

    ' Set the grid style to circular grid
    Call c.setGridStyle(False)

    ' Set the radial axis label format
    Call c.radialAxis().setLabelFormat("{value} ppm")

    ' Use semi-transparent (40ffffff) label background so as not to block the data
    Call c.radialAxis().setLabelStyle().setBackground(&H40ffffff, &H40000000)

    ' Add a legend box at (200, 30) top center aligned, using 9pt Arial Bold font. with a black
    ' border.
    Dim legendBox As LegendBox
    Set legendBox = c.addLegend(200, 30, False, "arialbd.ttf", 9)
    Call legendBox.setAlignment(cd.TopCenter)

    ' Add legend keys to represent the red/green/blue zones
    Call legendBox.addKey("Under-Absorp", &H9999ff)
    Call legendBox.addKey("Normal", &H99ff99)
    Call legendBox.addKey("Over-Absorp", &Hff9999)

    ' Add a blue (000080) spline line layer with line width set to 3 pixels and using yellow
    ' (ffff00) circles to represent the data points
    Dim layer As PolarSplineLineLayer
    Set layer = c.addSplineLineLayer(data, &H000080)
    Call layer.setLineWidth(3)
    Call layer.setDataSymbol(cd.CircleShape, 11, &Hffff00)

    ' Set the labels to the angular axis as spokes.
    Call c.angularAxis().setLabels(labels)

    ' Output the chart
    Set viewer.Picture = c.makePicture()

    ' Include tool tip for the chart.
    viewer.ImageMap = layer.getHTMLImageMap("clickable", "", _
        "title='Concentration on {label}: {value} ppm'")

End Sub
© 2021 Advanced Software Engineering Limited. All rights reserved.