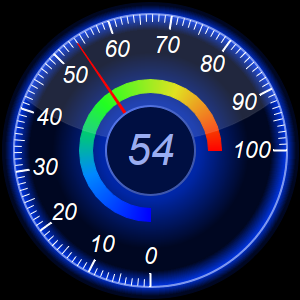

This example demonstrates round meters configured with a large pointer cap to display the meter value.
The pointer cap is the circular object at the center of the meter. In this example, using
AngularMeter.setCap2, the pointer cap is set to an exceptionally large size so that it can act as a place to display text. The text is added using
BaseChart.addText, centered at the meter center.
In one of the meters, the pointer is configured to be floating, which means the base of the pointer is not fixed at the meter center. The pointer looks like a triangle somewhere between the center and the perimeter, pointing to the meter value. This pointer is added using
AngularMeter.addPointer2 with
TriangularPointer2 just like a standard pointer, but with additional arguments to specify the radial position of the pointer base and tip, as well as the pointer width.
[Web Version (in ASP)] aspdemo\roundmeterreadout.asp
<%@ language="vbscript" %>
<%
Set cd = CreateObject("ChartDirector.API")

' This script can draw different charts depending on the chartIndex
Sub createChart(viewer, chartIndex)

    ' The value to display on the meter
    value = 54

    ' The main color of the four meters in this example. The other colors and gradients are derived
    ' from the main color.
    colorList = Array(&H0033dd, &Haaaa00)
    mainColor = colorList(chartIndex)

    '
    ' In this example, we demonstrate how to parameterized by size, so that the chart size can be
    ' changed by changing just one variable.
    '
    size = 300

    ' The radius of the entire meter, which is size / 2, minus 2 pixels for margin
    outerRadius = Int(size / 2 - 2)

    ' The radius of the meter scale
    scaleRadius = Int(outerRadius * 92 / 100)

    ' The radius of the color scale
    colorScaleRadius = Int(scaleRadius * 43 / 100)

    ' The width of the color scale
    colorScaleWidth = Int(scaleRadius * 10 / 100)

    ' Major tick length
    tickLength = Int(scaleRadius * 10 / 100)

    ' Major tick width
    tickWidth = Int(scaleRadius * 1 / 100 + 1)

    ' Label font size
    fontSize = Int(scaleRadius * 13 / 100)

    ' Radius of readout circle as a ratio to the scale radius
    readOutRadiusRatio = 0.333333333333

    ' Readout font size
    readOutFontSize = Int(scaleRadius * 24 / 100)

    '
    ' Create an angular meter based on the above parameters
    '

    ' Create an AngularMeter object of the specified size. In this demo, we use black (0x000000) as
    ' the background color. You can also use transparent or other colors.
    Set m = cd.AngularMeter(size, size, &H000000)

    ' Set the default text and line colors to white (0xffffff)
    Call m.setColor(cd.TextColor, &Hffffff)
    Call m.setColor(cd.LineColor, &Hffffff)

    ' Set meter center and scale radius, and set the scale angle from -180 to +90 degrees
    Call m.setMeter(size / 2, size / 2, scaleRadius, -180, 90)

    ' Background gradient with the mainColor at the center and become darker near the border
    bgGradient = Array(0, mainColor, 0.5, m.adjustBrightness(mainColor, 0.75), 1, _
        m.adjustBrightness(mainColor, 0.15))

    ' Fill the meter background with the background gradient
    Call m.addRing(0, outerRadius, m.relativeRadialGradient(bgGradient, outerRadius * 0.66))

    ' Gradient for the neon backlight, with the main color at the scale radius fading to transparent
    neonGradient = Array(0.89, cd.Transparent, 1, mainColor, 1.07, cd.Transparent)
    Call m.addRing(Int(scaleRadius * 85 / 100), outerRadius, m.relativeRadialGradient(neonGradient))

    ' The neon ring at the scale radius with width equal to 1/80 of the scale radius, creating using
    ' a brighter version of the main color
    Call m.addRing(scaleRadius, Int(scaleRadius + scaleRadius / 80), m.adjustBrightness(mainColor, _
        2))

    ' Meter scale is 0 - 100, with major/minor/micro ticks every 10/5/1 units
    Call m.setScale(0, 100, 10, 5, 1)

    ' Set the scale label style, tick length and tick width. The minor and micro tick lengths are
    ' 80% and 60% of the major tick length, and their widths are around half of the major tick
    ' width.
    Call m.setLabelStyle("Arial Italic", fontSize)
    Call m.setTickLength(-tickLength, -Int(tickLength * 80 / 100), -Int(tickLength * 60 / 100))
    Call m.setLineWidth(0, tickWidth, Int((tickWidth + 1) / 2), Int((tickWidth + 1) / 2))

    ' Demostrate different types of color scales and putting them at different positions.
    smoothColorScale = Array(0, &H0000ff, 25, &H0088ff, 50, &H00ff00, 75, &Hdddd00, 100, &Hff0000)
    highColorScale = Array(70, cd.Transparent, 100, &Hff0000)

    If chartIndex = 0 Then
        ' Add the smooth color scale
        Call m.addColorScale(smoothColorScale, colorScaleRadius, colorScaleWidth)
        ' Add a red (0xff0000) pointer
        Call m.addPointer2(value, &Hff0000)
    Else
        ' Add the high color scale at the default position
        Call m.addColorScale(highColorScale)
        ' Add a red (0xff0000) triangular pointer starting from 40% and ending at 60% of scale
        ' radius, with a width 6 times the default
        Call m.addPointer2(value, &Hff0000, -1, cd.TriangularPointer2, 0.4, 0.6, 6)
    End If

    ' Configure a large "pointer cap" to be used as the readout circle at the center. The cap border
    ' width is set to 1.5% of the scale radius. The cap color is darker version of the main color.
    ' The border color is a brighter version of the main color with 75% brightness gradient effect.
    Call m.setCap2(cd.Transparent, m.adjustBrightness(mainColor, 0.3), m.adjustBrightness( _
        mainColor, 1.5), 0.75, 0, readOutRadiusRatio, 0.015)

    ' Add value label at the center using a brighter version of the main color and Arial Italic font
    Call m.addText(size / 2, size / 2, m.formatValue(value, "{value|0}"), "Arial Italic", _
        readOutFontSize, m.adjustBrightness(mainColor, 2.5), cd.Center).setMargin(0)

    ' Add glare up to the scale radius
    Call m.addGlare(scaleRadius)

    ' Output the chart
    Call viewer.setChart(m, cd.SVG)
End Sub

' This example includes 2 charts
Dim viewers(1)
For i = 0 To Ubound(viewers)
    Set viewers(i) = cd.WebChartViewer(Request, "chart" & i)
    Call createChart(viewers(i), i)
Next
%>

<!DOCTYPE html>
<html>
<head>
    <title>Round Meters with Readout</title>
    <!-- Include ChartDirector Javascript Library to support chart interactions -->
    <script type="text/javascript" src="cdjcv.js"></script>
</head>
<body style="margin:5px 0px 0px 5px">
    <div style="font:bold 18pt verdana;">
        Round Meters with Readout
    </div>
    <hr style="border:solid 1px #000080; background:#000080" />
    <div style="font:10pt verdana; margin-bottom:1.5em">
        <a href="viewsource.asp?file=<%= Request("SCRIPT_NAME") %>">View Chart Source Code</a>
    </div>
    <!-- ****** Here are the chart images ****** -->
    <%
        For i = 0 To Ubound(viewers)
            Call Response.Write(viewers(i).renderHTML())
            Call Response.Write(" ")
        Next
    %>
</body>
</html>
[Windows Version (in Visual Basic)] vbdemo\roundmeterreadout.cls
Public Sub createChart(viewer As Object, chartIndex As Integer)

    Dim cd As New ChartDirector.API

    ' The value to display on the meter
    Dim value As Double
    value = 54

    ' The main color of the four meters in this example. The other colors and gradients are derived
    ' from the main color.
    Dim colorList()
    colorList = Array(&H0033dd, &Haaaa00)
    Dim mainColor As Long
    mainColor = colorList(chartIndex)

    '
    ' In this example, we demonstrate how to parameterized by size, so that the chart size can be
    ' changed by changing just one variable.
    '
    Dim size As Long
    size = 300

    ' The radius of the entire meter, which is size / 2, minus 2 pixels for margin
    Dim outerRadius As Long
    outerRadius = Int(size / 2 - 2)

    ' The radius of the meter scale
    Dim scaleRadius As Long
    scaleRadius = Int(outerRadius * 92 / 100)

    ' The radius of the color scale
    Dim colorScaleRadius As Long
    colorScaleRadius = Int(scaleRadius * 43 / 100)

    ' The width of the color scale
    Dim colorScaleWidth As Long
    colorScaleWidth = Int(scaleRadius * 10 / 100)

    ' Major tick length
    Dim tickLength As Long
    tickLength = Int(scaleRadius * 10 / 100)

    ' Major tick width
    Dim tickWidth As Long
    tickWidth = Int(scaleRadius * 1 / 100 + 1)

    ' Label font size
    Dim fontSize As Long
    fontSize = Int(scaleRadius * 13 / 100)

    ' Radius of readout circle as a ratio to the scale radius
    Dim readOutRadiusRatio As Double
    readOutRadiusRatio = 0.333333333333

    ' Readout font size
    Dim readOutFontSize As Long
    readOutFontSize = Int(scaleRadius * 24 / 100)

    '
    ' Create an angular meter based on the above parameters
    '

    ' Create an AngularMeter object of the specified size. In this demo, we use black (0x000000) as
    ' the background color. You can also use transparent or other colors.
    Dim m As AngularMeter
    Set m = cd.AngularMeter(size, size, &H000000)

    ' Set the default text and line colors to white (0xffffff)
    Call m.setColor(cd.TextColor, &Hffffff)
    Call m.setColor(cd.LineColor, &Hffffff)

    ' Set meter center and scale radius, and set the scale angle from -180 to +90 degrees
    Call m.setMeter(size / 2, size / 2, scaleRadius, -180, 90)

    ' Background gradient with the mainColor at the center and become darker near the border
    Dim bgGradient()
    bgGradient = Array(0, mainColor, 0.5, m.adjustBrightness(mainColor, 0.75), 1, _
        m.adjustBrightness(mainColor, 0.15))

    ' Fill the meter background with the background gradient
    Call m.addRing(0, outerRadius, m.relativeRadialGradient(bgGradient, outerRadius * 0.66))

    ' Gradient for the neon backlight, with the main color at the scale radius fading to transparent
    Dim neonGradient()
    neonGradient = Array(0.89, cd.Transparent, 1, mainColor, 1.07, cd.Transparent)
    Call m.addRing(Int(scaleRadius * 85 / 100), outerRadius, m.relativeRadialGradient(neonGradient))

    ' The neon ring at the scale radius with width equal to 1/80 of the scale radius, creating using
    ' a brighter version of the main color
    Call m.addRing(scaleRadius, Int(scaleRadius + scaleRadius / 80), m.adjustBrightness(mainColor, _
        2))

    ' Meter scale is 0 - 100, with major/minor/micro ticks every 10/5/1 units
    Call m.setScale(0, 100, 10, 5, 1)

    ' Set the scale label style, tick length and tick width. The minor and micro tick lengths are
    ' 80% and 60% of the major tick length, and their widths are around half of the major tick
    ' width.
    Call m.setLabelStyle("ariali.ttf", fontSize)
    Call m.setTickLength(-tickLength, -Int(tickLength * 80 / 100), -Int(tickLength * 60 / 100))
    Call m.setLineWidth(0, tickWidth, Int((tickWidth + 1) / 2), Int((tickWidth + 1) / 2))

    ' Demostrate different types of color scales and putting them at different positions.
    Dim smoothColorScale()
    smoothColorScale = Array(0, &H0000ff, 25, &H0088ff, 50, &H00ff00, 75, &Hdddd00, 100, &Hff0000)
    Dim highColorScale()
    highColorScale = Array(70, cd.Transparent, 100, &Hff0000)

    If chartIndex = 0 Then
        ' Add the smooth color scale
        Call m.addColorScale(smoothColorScale, colorScaleRadius, colorScaleWidth)
        ' Add a red (0xff0000) pointer
        Call m.addPointer2(value, &Hff0000)
    Else
        ' Add the high color scale at the default position
        Call m.addColorScale(highColorScale)
        ' Add a red (0xff0000) triangular pointer starting from 40% and ending at 60% of scale
        ' radius, with a width 6 times the default
        Call m.addPointer2(value, &Hff0000, -1, cd.TriangularPointer2, 0.4, 0.6, 6)
    End If

    ' Configure a large "pointer cap" to be used as the readout circle at the center. The cap border
    ' width is set to 1.5% of the scale radius. The cap color is darker version of the main color.
    ' The border color is a brighter version of the main color with 75% brightness gradient effect.
    Call m.setCap2(cd.Transparent, m.adjustBrightness(mainColor, 0.3), m.adjustBrightness( _
        mainColor, 1.5), 0.75, 0, readOutRadiusRatio, 0.015)

    ' Add value label at the center using a brighter version of the main color and Arial Italic font
    Call m.addText(size / 2, size / 2, m.formatValue(value, "{value|0}"), "ariali.ttf", _
        readOutFontSize, m.adjustBrightness(mainColor, 2.5), cd.Center).setMargin(0)

    ' Add glare up to the scale radius
    Call m.addGlare(scaleRadius)

    ' Output the chart
    Set viewer.Picture = m.makePicture()

End Sub
© 2021 Advanced Software Engineering Limited. All rights reserved.