[Web Version (in ASP)] aspdemo\scattersurface.asp
<%@ language="vbscript" %>
<%
Set cd = CreateObject("ChartDirector.API")
' The (x, y, z) coordinates of the scattered data
dataX = Array(0.5, 1.9, 4.9, 1.0, 8.9, 9.8, 5.9, 2.9, 6.8, 9.0, 0.0, 8.9, 1.9, 4.8, 2.4, 3.4, 7.9, _
7.5, 4.8, 7.5, 9.5, 0.4, 8.9, 0.9, 5.4, 9.4, 2.9, 8.9, 0.9, 8.9, 10.0, 1.0, 6.8, 3.8, 9.0, _
5.3, 6.4, 4.9, 4.5, 2.0, 5.4, 0.0, 10.0, 3.9, 5.4, 5.9, 5.8, 0.3, 4.4, 8.3)
dataY = Array(3.3, 3.0, 0.7, 1.0, 9.3, 4.5, 8.4, 0.1, 0.8, 0.1, 9.3, 1.8, 4.3, 1.3, 2.3, 5.4, 6.9, _
9.0, 9.8, 7.5, 1.8, 1.4, 4.5, 7.8, 3.8, 4.0, 2.9, 2.4, 3.9, 2.9, 2.3, 9.3, 2.0, 3.4, 4.8, 2.3, _
3.4, 2.3, 1.5, 7.8, 4.5, 0.9, 6.3, 2.4, 6.9, 2.8, 1.3, 2.9, 6.4, 6.3)
dataZ = Array(6.6, 12.5, 7.4, 6.2, 9.6, 13.6, 19.9, 2.2, 6.9, 3.4, 8.7, 8.4, 7.8, 8.0, 9.4, 11.9, _
9.6, 15.7, 12.0, 13.3, 9.6, 6.4, 9.0, 6.9, 4.6, 9.7, 10.6, 9.2, 7.0, 6.9, 9.7, 8.6, 8.0, 13.6, _
13.2, 5.9, 9.0, 3.2, 8.3, 9.7, 8.2, 6.1, 8.7, 5.6, 14.9, 9.8, 9.3, 5.1, 10.8, 9.8)
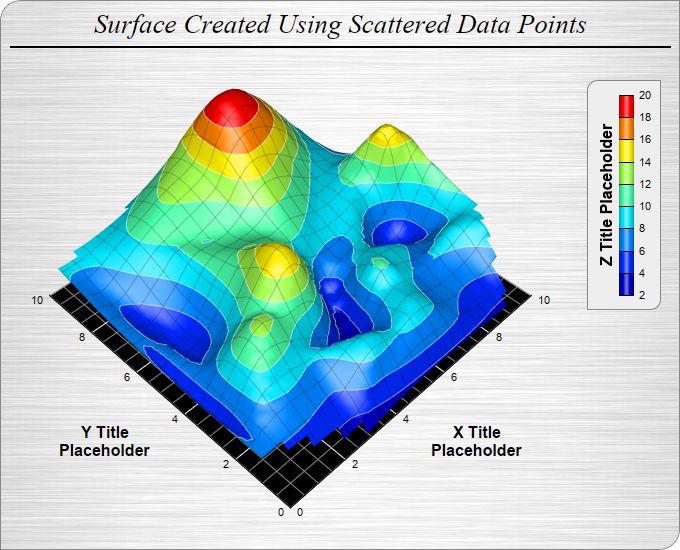
' Create a SurfaceChart object of size 680 x 550 pixels. Set background to brushed silver and border
' to grey (888888). Set the top-left and bottom-right corners to rounded corners with 20 pixels
' radius.
Set c = cd.SurfaceChart(680, 550, cd.brushedSilverColor(), &H888888)
Call c.setRoundedFrame(&Hffffff, 20, 0, 20, 0)
' Add a title to the chart using 20 points Times New Roman Italic font. Set top/bottom margin to 8
' pixels.
Set title = c.addTitle("Surface Created Using Scattered Data Points", "Times New Roman Italic", 20)
Call title.setMargin2(0, 0, 8, 8)
' Add a 2 pixel wide black (000000) separator line under the title
Call c.addLine(10, title.getHeight(), c.getWidth() - 10, title.getHeight(), &H000000, 2)
' Set the center of the plot region at (290, 235), and set width x depth x height to 360 x 360 x 180
' pixels
Call c.setPlotRegion(290, 235, 360, 360, 180)
' Set the elevation and rotation angles to 45 and -45 degrees
Call c.setViewAngle(45, -45)
' Set the perspective level to 30
Call c.setPerspective(30)
' Set the data to use to plot the chart
Call c.setData(dataX, dataY, dataZ)
' Add a color axis (the legend) in which the top right corner is anchored at (660, 80). Set the
' length to 200 pixels and the labels on the right side.
Set cAxis = c.setColorAxis(660, 80, cd.TopRight, 200, cd.Right)
' Set the color axis title with 12 points Arial Bold font
Call cAxis.setTitle("Z Title Placeholder", "Arial Bold", 12)
' Add a bounding box with light grey (eeeeee) background and grey (888888) border. Set the top-left
' and bottom-right corners to rounded corners of 10 pixels radius.
Call cAxis.setBoundingBox(&Heeeeee, &H888888)
Call cAxis.setRoundedCorners(10, 0, 10, 0)
' Set surface grid lines to semi-transparent black (cc000000)
Call c.setSurfaceAxisGrid(&Hcc000000)
' Set contour lines to semi-transparent white (80ffffff)
Call c.setContourColor(&H80ffffff)
' Set the walls to black in color
Call c.setWallColor(&H000000)
' Set the xyz major wall grid lines to white (ffffff), and minor wall grid lines to grey (888888)
Call c.setWallGrid(&Hffffff, &Hffffff, &Hffffff, &H888888, &H888888, &H888888)
' Set the wall thickness to 0
Call c.setWallThickness(0, 0, 0)
' Show only the xy wall, and hide the yz and zx walls.
Call c.setWallVisibility(True, False, False)
' Set the x, y and z axis titles using 12 points Arial Bold font
Call c.xAxis().setTitle("X Title<*br*>Placeholder", "Arial Bold", 12)
Call c.yAxis().setTitle("Y Title<*br*>Placeholder", "Arial Bold", 12)
' Output the chart
Set viewer = cd.WebChartViewer(Request, "chart1")
Call viewer.setChart(c, cd.SVG)
%>
<!DOCTYPE html>
<html>
<head>
<title>Scattered Data Surface Chart</title>
<!-- Include ChartDirector Javascript Library to support chart interactions -->
<script type="text/javascript" src="cdjcv.js"></script>
</head>
<body style="margin:5px 0px 0px 5px">
<div style="font:bold 18pt verdana;">
Scattered Data Surface Chart
</div>
<hr style="border:solid 1px #000080; background:#000080" />
<div style="font:10pt verdana; margin-bottom:1.5em">
<a href="viewsource.asp?file=<%= Request("SCRIPT_NAME") %>">View Chart Source Code</a>
</div>
<!-- ****** Here is the chart image ****** -->
<%= viewer.renderHTML() %>
</body>
</html>
[Windows Version (in Visual Basic)] vbdemo\scattersurface.cls
Public Sub createChart(viewer As Object, chartIndex As Integer)

    Dim cd As New ChartDirector.API

    ' The (x, y, z) coordinates of the scattered data
    Dim dataX()
    dataX = Array(0.5, 1.9, 4.9, 1.0, 8.9, 9.8, 5.9, 2.9, 6.8, 9.0, 0.0, 8.9, 1.9, 4.8, 2.4, 3.4, _
        7.9, 7.5, 4.8, 7.5, 9.5, 0.4, 8.9, 0.9, 5.4, 9.4, 2.9, 8.9, 0.9, 8.9, 10.0, 1.0, 6.8, 3.8, _
        9.0, 5.3, 6.4, 4.9, 4.5, 2.0, 5.4, 0.0, 10.0, 3.9, 5.4, 5.9, 5.8, 0.3, 4.4, 8.3)
    Dim dataY()
    dataY = Array(3.3, 3.0, 0.7, 1.0, 9.3, 4.5, 8.4, 0.1, 0.8, 0.1, 9.3, 1.8, 4.3, 1.3, 2.3, 5.4, _
        6.9, 9.0, 9.8, 7.5, 1.8, 1.4, 4.5, 7.8, 3.8, 4.0, 2.9, 2.4, 3.9, 2.9, 2.3, 9.3, 2.0, 3.4, _
        4.8, 2.3, 3.4, 2.3, 1.5, 7.8, 4.5, 0.9, 6.3, 2.4, 6.9, 2.8, 1.3, 2.9, 6.4, 6.3)
    Dim dataZ()
    dataZ = Array(6.6, 12.5, 7.4, 6.2, 9.6, 13.6, 19.9, 2.2, 6.9, 3.4, 8.7, 8.4, 7.8, 8.0, 9.4, _
        11.9, 9.6, 15.7, 12.0, 13.3, 9.6, 6.4, 9.0, 6.9, 4.6, 9.7, 10.6, 9.2, 7.0, 6.9, 9.7, 8.6, _
        8.0, 13.6, 13.2, 5.9, 9.0, 3.2, 8.3, 9.7, 8.2, 6.1, 8.7, 5.6, 14.9, 9.8, 9.3, 5.1, 10.8, _
        9.8)

    ' Create a SurfaceChart object of size 680 x 550 pixels. Set background to brushed silver and
    ' border to grey (888888). Set the top-left and bottom-right corners to rounded corners with 20
    ' pixels radius.
    Dim c As SurfaceChart
    Set c = cd.SurfaceChart(680, 550, cd.brushedSilverColor(), &H888888)
    Call c.setRoundedFrame(&Hffffff, 20, 0, 20, 0)

    ' Add a title to the chart using 20 points Times New Roman Italic font. Set top/bottom margin to
    ' 8 pixels.
    Dim title As ChartDirector.TextBox
    Set title = c.addTitle("Surface Created Using Scattered Data Points", "timesi.ttf", 20)
    Call title.setMargin2(0, 0, 8, 8)

    ' Add a 2 pixel wide black (000000) separator line under the title
    Call c.addLine(10, title.getHeight(), c.getWidth() - 10, title.getHeight(), &H000000, 2)

    ' Set the center of the plot region at (290, 235), and set width x depth x height to 360 x 360 x
    ' 180 pixels
    Call c.setPlotRegion(290, 235, 360, 360, 180)

    ' Set the elevation and rotation angles to 45 and -45 degrees
    Call c.setViewAngle(45, -45)

    ' Set the perspective level to 30
    Call c.setPerspective(30)

    ' Set the data to use to plot the chart
    Call c.setData(dataX, dataY, dataZ)

    ' Add a color axis (the legend) in which the top right corner is anchored at (660, 80). Set the
    ' length to 200 pixels and the labels on the right side.
    Dim cAxis As ColorAxis
    Set cAxis = c.setColorAxis(660, 80, cd.TopRight, 200, cd.Right)

    ' Set the color axis title with 12 points Arial Bold font
    Call cAxis.setTitle("Z Title Placeholder", "arialbd.ttf", 12)

    ' Add a bounding box with light grey (eeeeee) background and grey (888888) border. Set the
    ' top-left and bottom-right corners to rounded corners of  10 pixels radius.
    Call cAxis.setBoundingBox(&Heeeeee, &H888888)
    Call cAxis.setRoundedCorners(10, 0, 10, 0)

    ' Set surface grid lines to semi-transparent black (cc000000)
    Call c.setSurfaceAxisGrid(&Hcc000000)

    ' Set contour lines to semi-transparent white (80ffffff)
    Call c.setContourColor(&H80ffffff)

    ' Set the walls to black in color
    Call c.setWallColor(&H000000)

    ' Set the xyz major wall grid lines to white (ffffff), and minor wall grid lines to grey
    ' (888888)
    Call c.setWallGrid(&Hffffff, &Hffffff, &Hffffff, &H888888, &H888888, &H888888)

    ' Set the wall thickness to 0
    Call c.setWallThickness(0, 0, 0)

    ' Show only the xy wall, and hide the yz and zx walls.
    Call c.setWallVisibility(True, False, False)

    ' Set the x, y and z axis titles using 12 points Arial Bold font
    Call c.xAxis().setTitle("X Title<*br*>Placeholder", "arialbd.ttf", 12)
    Call c.yAxis().setTitle("Y Title<*br*>Placeholder", "arialbd.ttf", 12)

    ' Output the chart
    Set viewer.Picture = c.makePicture()

End Sub
© 2021 Advanced Software Engineering Limited. All rights reserved.