This example demonstrates the basic steps in creating a semicircle meter.
A semicircle meter can be created with the following steps:
[Web Version (in ASP)] aspdemo\semicirclemeter.asp
<%@ language="vbscript" %>
<%
Set cd = CreateObject("ChartDirector.API")
' The value to display on the meter
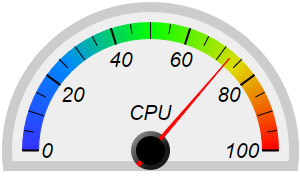
value = 72.55
' Create an AngularMeter object of size 300 x 180 pixels with transparent background
Set m = cd.AngularMeter(300, 180, cd.Transparent)
' Center at (150, 150), scale radius = 128 pixels, scale angle -90 to +90 degrees
Call m.setMeter(150, 150, 128, -90, 90)
' Add a pale grey (0xeeeeee) scale background of 148 pixels radius, with a 10 pixel thick light grey
' (0xcccccc) border
Call m.addScaleBackground(148, &Heeeeee, 10, &Hcccccc)
' Meter scale is 0 - 100, with major tick every 20 units, minor tick every 10 units, and micro tick
' every 5 units
Call m.setScale(0, 100, 20, 10, 5)
' Set the scale label style to 15pt Arial Italic. Set the major/minor/micro tick lengths to 16/16/10
' pixels pointing inwards, and their widths to 2/1/1 pixels.
Call m.setLabelStyle("Arial Italic", 16)
Call m.setTickLength(-16, -16, -10)
Call m.setLineWidth(0, 2, 1, 1)
' Add a smooth color scale to the meter
smoothColorScale = Array(0, &H3333ff, 25, &H0088ff, 50, &H00ff00, 75, &Hdddd00, 100, &Hff0000)
Call m.addColorScale(smoothColorScale)
' Add a text label centered at (150, 125) with 15pt Arial Italic font
Call m.addText(150, 125, "CPU", "Arial Italic", 15, cd.TextColor, cd.BottomCenter)
' Add a red (0xff0000) pointer at the specified value
Call m.addPointer2(value, &Hff0000)
' Output the chart
Set viewer = cd.WebChartViewer(Request, "chart1")
Call viewer.setChart(m, cd.SVG)
%>
<!DOCTYPE html>
<html>
<head>
<title>Semicircle Meter</title>
<!-- Include ChartDirector Javascript Library to support chart interactions -->
<script type="text/javascript" src="cdjcv.js"></script>
</head>
<body style="margin:5px 0px 0px 5px">
<div style="font:bold 18pt verdana;">
Semicircle Meter
</div>
<hr style="border:solid 1px #000080; background:#000080" />
<div style="font:10pt verdana; margin-bottom:1.5em">
<a href="viewsource.asp?file=<%= Request("SCRIPT_NAME") %>">View Chart Source Code</a>
</div>
<!-- ****** Here is the chart image ****** -->
<%= viewer.renderHTML() %>
</body>
</html>
[Windows Version (in Visual Basic)] vbdemo\semicirclemeter.cls
Public Sub createChart(viewer As Object, chartIndex As Integer)

    Dim cd As New ChartDirector.API

    ' The value to display on the meter
    Dim value As Double
    value = 72.55

    ' Create an AngularMeter object of size 300 x 180 pixels
    Dim m As AngularMeter
    Set m = cd.AngularMeter(300, 180)

    ' Center at (150, 150), scale radius = 128 pixels, scale angle -90 to +90 degrees
    Call m.setMeter(150, 150, 128, -90, 90)

    ' Add a pale grey (0xeeeeee) scale background of 148 pixels radius, with a 10 pixel thick light
    ' grey (0xcccccc) border
    Call m.addScaleBackground(148, &Heeeeee, 10, &Hcccccc)

    ' Meter scale is 0 - 100, with major tick every 20 units, minor tick every 10 units, and micro
    ' tick every 5 units
    Call m.setScale(0, 100, 20, 10, 5)

    ' Set the scale label style to 15pt Arial Italic. Set the major/minor/micro tick lengths to
    ' 16/16/10 pixels pointing inwards, and their widths to 2/1/1 pixels.
    Call m.setLabelStyle("ariali.ttf", 16)
    Call m.setTickLength(-16, -16, -10)
    Call m.setLineWidth(0, 2, 1, 1)

    ' Add a smooth color scale to the meter
    Dim smoothColorScale()
    smoothColorScale = Array(0, &H3333ff, 25, &H0088ff, 50, &H00ff00, 75, &Hdddd00, 100, &Hff0000)
    Call m.addColorScale(smoothColorScale)

    ' Add a text label centered at (150, 125) with 15pt Arial Italic font
    Call m.addText(150, 125, "CPU", "ariali.ttf", 15, cd.TextColor, cd.BottomCenter)

    ' Add a red (0xff0000) pointer at the specified value
    Call m.addPointer2(value, &Hff0000)

    ' Output the chart
    Set viewer.Picture = m.makePicture()

End Sub
© 2021 Advanced Software Engineering Limited. All rights reserved.