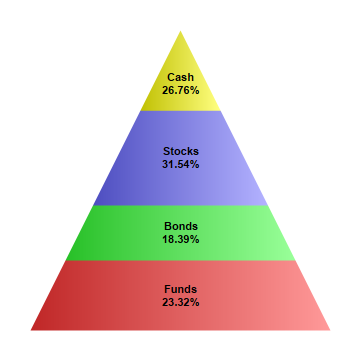
This example demonstrates the basic steps in creating pyramid charts.
[Web Version (in ASP)] aspdemo\simplepyramid.asp
<%@ language="vbscript" %>
<%
Set cd = CreateObject("ChartDirector.API")

' The data for the pyramid chart
data = Array(156, 123, 211, 179)

' The labels for the pyramid chart
labels = Array("Funds", "Bonds", "Stocks", "Cash")

' Create a PyramidChart object of size 360 x 360 pixels
Set c = cd.PyramidChart(360, 360)

' Set the pyramid center at (180, 180), and width x height to 150 x 180 pixels
Call c.setPyramidSize(180, 180, 150, 300)

' Set the pyramid data and labels
Call c.setData(data, labels)

' Add labels at the center of the pyramid layers using Arial Bold font. The labels will have two
' lines showing the layer name and percentage.
Call c.setCenterLabel("{label}<*br*>{percent}%", "Arial Bold")

' Output the chart
Set viewer = cd.WebChartViewer(Request, "chart1")
Call viewer.setChart(c, cd.SVG)

' Include tool tip for the chart
viewer.ImageMap = c.getHTMLImageMap("", "", "title='{label}: US$ {value}M ({percent}%)'")
%>

<!DOCTYPE html>
<html>
<head>
    <title>Simple Pyramid Chart</title>
    <!-- Include ChartDirector Javascript Library to support chart interactions -->
    <script type="text/javascript" src="cdjcv.js"></script>
</head>
<body style="margin:5px 0px 0px 5px">
    <div style="font:bold 18pt verdana;">
        Simple Pyramid Chart
    </div>
    <hr style="border:solid 1px #000080; background:#000080" />
    <div style="font:10pt verdana; margin-bottom:1.5em">
        <a href="viewsource.asp?file=<%= Request("SCRIPT_NAME") %>">View Chart Source Code</a>
    </div>
    <!-- ****** Here is the chart image ****** -->
    <%= viewer.renderHTML() %>
</body>
</html>
[Windows Version (in Visual Basic)] vbdemo\simplepyramid.cls
Public Sub createChart(viewer As Object, chartIndex As Integer)

    Dim cd As New ChartDirector.API

    ' The data for the pyramid chart
    Dim data()
    data = Array(156, 123, 211, 179)

    ' The labels for the pyramid chart
    Dim labels()
    labels = Array("Funds", "Bonds", "Stocks", "Cash")

    ' Create a PyramidChart object of size 360 x 360 pixels
    Dim c As PyramidChart
    Set c = cd.PyramidChart(360, 360)

    ' Set the pyramid center at (180, 180), and width x height to 150 x 180 pixels
    Call c.setPyramidSize(180, 180, 150, 300)

    ' Set the pyramid data and labels
    Call c.setData(data, labels)

    ' Add labels at the center of the pyramid layers using Arial Bold font. The labels will have two
    ' lines showing the layer name and percentage.
    Call c.setCenterLabel("{label}<*br*>{percent}%", "arialbd.ttf")

    ' Output the chart
    Set viewer.Picture = c.makePicture()

    'include tool tip for the chart
    viewer.ImageMap = c.getHTMLImageMap("clickable", "", _
        "title='{label}: US$ {value}M ({percent}%)'")

End Sub
© 2021 Advanced Software Engineering Limited. All rights reserved.