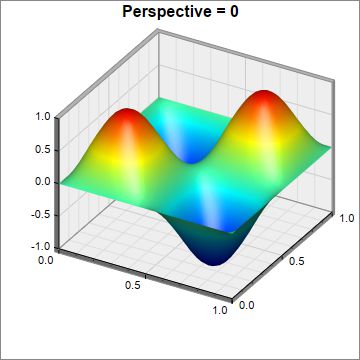
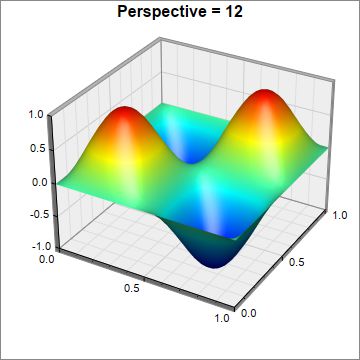
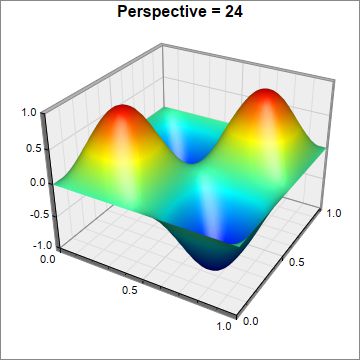
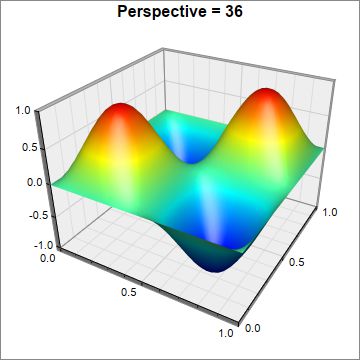
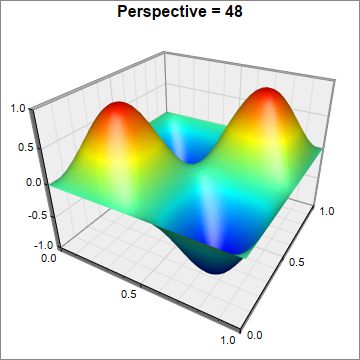
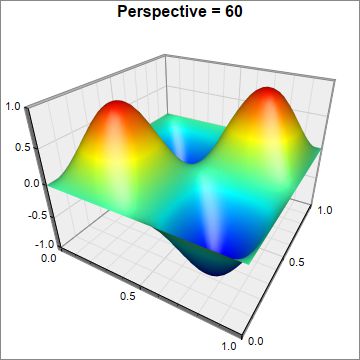
This example demonstrates the effects of various perspective depth, configured using ThreeDChart.setPerspective.
ChartDirector 7.0 (ASP/COM/VB Edition)
Surface Perspective
Source Code Listing
<%@ language="vbscript" %>
<%
Set cd = CreateObject("ChartDirector.API")

' This script can draw different charts depending on the chartIndex
Sub createChart(viewer, chartIndex)

    ' The x and y coordinates of the grid
    dataX = Array(0, 0.1, 0.2, 0.3, 0.4, 0.5, 0.6, 0.7, 0.8, 0.9, 1.0)
    dataY = Array(0, 0.1, 0.2, 0.3, 0.4, 0.5, 0.6, 0.7, 0.8, 0.9, 1.0)

    ' The values at the grid points. In this example, we will compute the values using the formula z
    ' = sin((x - 0.5) * 2 * pi) * sin((y - 0.5) * 2 * pi)
    ReDim dataZ((UBound(dataX) + 1) * (UBound(dataY) + 1) - 1)
    For yIndex = 0 To UBound(dataY)
        y = (dataY(yIndex) - 0.5) * 2 * 3.1416
        For xIndex = 0 To UBound(dataX)
            x = (dataX(xIndex) - 0.5) * 2 * 3.1416
            dataZ(yIndex * (UBound(dataX) + 1) + xIndex) = Sin(x) * Sin(y)
        Next
    Next

    ' the perspective level
    perspective = chartIndex * 12

    ' Create a SurfaceChart object of size 360 x 360 pixels, with white (ffffff) background and grey
    ' (888888) border.
    Set c = cd.SurfaceChart(360, 360, &Hffffff, &H888888)

    ' Set the perspective level
    Call c.setPerspective(perspective)
    Call c.addTitle("Perspective = " & perspective)

    ' Set the center of the plot region at (195, 165), and set width x depth x height to 200 x 200 x
    ' 150 pixels
    Call c.setPlotRegion(195, 165, 200, 200, 150)

    ' Set the plot region wall thichness to 5 pixels
    Call c.setWallThickness(5)

    ' Set the elevation and rotation angles to 30 and 30 degrees
    Call c.setViewAngle(30, 30)

    ' Set the data to use to plot the chart
    Call c.setData(dataX, dataY, dataZ)

    ' Spline interpolate data to a 40 x 40 grid for a smooth surface
    Call c.setInterpolation(40, 40)

    ' Use smooth gradient coloring.
    Call c.colorAxis().setColorGradient()

    ' Output the chart
    Call viewer.setChart(c, cd.SVG)
End Sub

' This example includes 6 charts
Dim viewers(5)
For i = 0 To Ubound(viewers)
    Set viewers(i) = cd.WebChartViewer(Request, "chart" & i)
    Call createChart(viewers(i), i)
Next
%>

<!DOCTYPE html>
<html>
<head>
    <title>Surface Perspective</title>
    <!-- Include ChartDirector Javascript Library to support chart interactions -->
    <script type="text/javascript" src="cdjcv.js"></script>
</head>
<body style="margin:5px 0px 0px 5px">
    <div style="font:bold 18pt verdana;">
        Surface Perspective
    </div>
    <hr style="border:solid 1px #000080; background:#000080" />
    <div style="font:10pt verdana; margin-bottom:1.5em">
        <a href="viewsource.asp?file=<%= Request("SCRIPT_NAME") %>">View Chart Source Code</a>
    </div>
    <!-- ****** Here are the chart images ****** -->
    <%
        For i = 0 To Ubound(viewers)
            Call Response.Write(viewers(i).renderHTML())
            Call Response.Write(" ")
        Next
    %>
</body>
</html>Public Sub createChart(viewer As Object, chartIndex As Integer)
Dim cd As New ChartDirector.API
' The x and y coordinates of the grid
Dim dataX()
dataX = Array(0, 0.1, 0.2, 0.3, 0.4, 0.5, 0.6, 0.7, 0.8, 0.9, 1.0)
Dim dataY()
dataY = Array(0, 0.1, 0.2, 0.3, 0.4, 0.5, 0.6, 0.7, 0.8, 0.9, 1.0)
' The values at the grid points. In this example, we will compute the values using the formula z
' = sin((x - 0.5) * 2 * pi) * sin((y - 0.5) * 2 * pi)
ReDim dataZ((UBound(dataX) + 1) * (UBound(dataY) + 1) - 1)
Dim yIndex As Long
For yIndex = 0 To UBound(dataY)
Dim y As Double
y = (dataY(yIndex) - 0.5) * 2 * 3.1416
Dim xIndex As Long
For xIndex = 0 To UBound(dataX)
Dim x As Double
x = (dataX(xIndex) - 0.5) * 2 * 3.1416
dataZ(yIndex * (UBound(dataX) + 1) + xIndex) = Sin(x) * Sin(y)
Next
Next
' the perspective level
Dim perspective As Long
perspective = chartIndex * 12
' Create a SurfaceChart object of size 360 x 360 pixels, with white (ffffff) background and grey
' (888888) border.
Dim c As SurfaceChart
Set c = cd.SurfaceChart(360, 360, &Hffffff, &H888888)
' Set the perspective level
Call c.setPerspective(perspective)
Call c.addTitle("Perspective = " & perspective)
' Set the center of the plot region at (195, 165), and set width x depth x height to 200 x 200 x
' 150 pixels
Call c.setPlotRegion(195, 165, 200, 200, 150)
' Set the plot region wall thichness to 5 pixels
Call c.setWallThickness(5)
' Set the elevation and rotation angles to 30 and 30 degrees
Call c.setViewAngle(30, 30)
' Set the data to use to plot the chart
Call c.setData(dataX, dataY, dataZ)
' Spline interpolate data to a 40 x 40 grid for a smooth surface
Call c.setInterpolation(40, 40)
' Use smooth gradient coloring.
Call c.colorAxis().setColorGradient()
' Output the chart
Set viewer.Picture = c.makePicture()
End Sub