The example demonstrates various tree map layout methods configurable using TreeMapNode.setLayoutMethod.
ChartDirector 7.0 (ASP/COM/VB Edition)
Tree Map Layout
Source Code Listing
<%@ language="vbscript" %>
<%
Set cd = CreateObject("ChartDirector.API")
' This script can draw different charts depending on the chartIndex
Sub createChart(viewer, chartIndex)
' Random data for the tree map
Set r = cd.RanSeries(3)
data = r.getSeries(20, 20, 400)
' Create a Tree Map object of size 300 x 300 pixels
Set c = cd.TreeMapChart(300, 300)
Call c.setPlotArea(20, 20, 260, 260)
' Obtain the root of the tree map, which is the entire plot area
Set root = c.getRootNode()
' Add first level nodes to the root.
Call root.setData(data)
If chartIndex = 0 Then
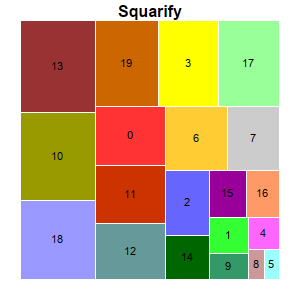
' Squarity - Layout the cells so that they are as square as possible.
Call c.addTitle("Squarify")
Call root.setLayoutMethod(cd.TreeMapSquarify)
ElseIf chartIndex = 1 Then
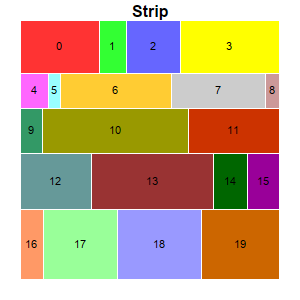
' Strip layout - Cells flow from left to right, top to bottom. The number of cells in each
' row is such that they will be as close to a square as possible. (The setLayoutMethod also
' supports other flow directions.)
Call c.addTitle("Strip")
Call root.setLayoutMethod(cd.TreeMapStrip)
ElseIf chartIndex = 2 Then
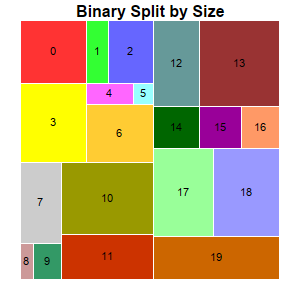
' Binary Split by Size - Split the cells into left/right groups so that their size are as
' close as possible. For each group, split the cells into top/bottom groups using the same
' criteria. Continue until each group contains one cell. (The setLayoutMethod also supports
' other flow directions.)
Call c.addTitle("Binary Split by Size")
Call root.setLayoutMethod(cd.TreeMapBinaryBySize)
ElseIf chartIndex = 3 Then
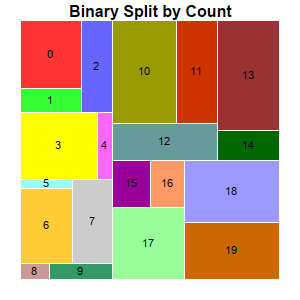
' Binary Split by Count - Same as "Binary Split by Size", except that the cell count
' (instead of the size) is used to split the cells.
Call c.addTitle("Binary Split by Count")
Call root.setLayoutMethod(cd.TreeMapBinaryByCount)
ElseIf chartIndex = 4 Then
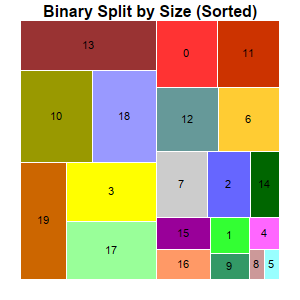
' Binary Split by Size (Sorted) - Same as "Binary Split by Size" except the cells are sorted
' first.
Call c.addTitle("Binary Split by Size (Sorted)")
Call root.setSorting(-1)
Call root.setLayoutMethod(cd.TreeMapBinaryBySize)
End If
' Get the prototype (template) for the first level nodes.
Set nodeConfig = c.getLevelPrototype(1)
' Set the label format for the nodes to show the label and value with 8pt Arial Bold font in
' black color (000000) and center aligned in the node.
Call nodeConfig.setLabelFormat("{index}", "Arial", 8, &H000000, cd.Center)
' Set automatic fill color and white (ffffff) border
Call nodeConfig.setColors(cd.DataColor, &Hffffff)
' Output the chart
Call viewer.setChart(c, cd.SVG)
' Include tool tip for the chart
viewer.ImageMap = c.getHTMLImageMap("", "", "title='<*cdml*><*b*>[{index}]<*/b*> {value|2}'")
End Sub
' This example includes 5 charts
Dim viewers(4)
For i = 0 To Ubound(viewers)
Set viewers(i) = cd.WebChartViewer(Request, "chart" & i)
Call createChart(viewers(i), i)
Next
%>
<!DOCTYPE html>
<html>
<head>
<title>Tree Map Layout</title>
<!-- Include ChartDirector Javascript Library to support chart interactions -->
<script type="text/javascript" src="cdjcv.js"></script>
</head>
<body style="margin:5px 0px 0px 5px">
<div style="font:bold 18pt verdana;">
Tree Map Layout
</div>
<hr style="border:solid 1px #000080; background:#000080" />
<div style="font:10pt verdana; margin-bottom:1.5em">
<a href="viewsource.asp?file=<%= Request("SCRIPT_NAME") %>">View Chart Source Code</a>
</div>
<!-- ****** Here are the chart images ****** -->
<%
For i = 0 To Ubound(viewers)
Call Response.Write(viewers(i).renderHTML())
Call Response.Write(" ")
Next
%>
</body>
</html>