This example is modified from
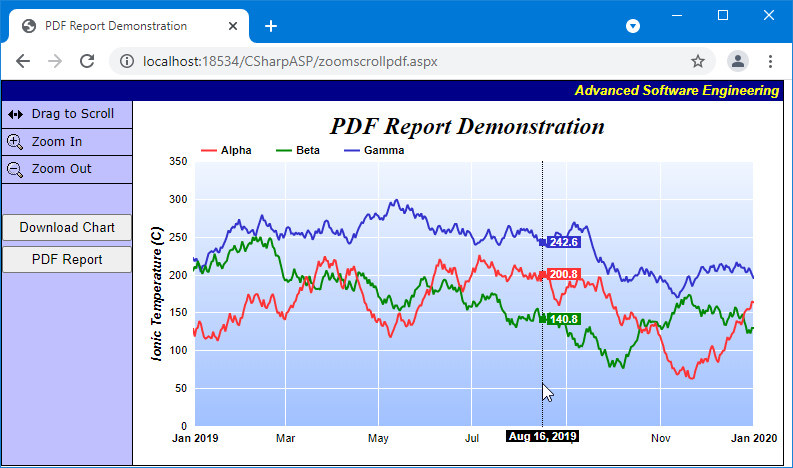
Zooming and Scrolling with Track Line (Web) to demonstrate creating a PDF report with multiple charts covering the entire data range.
This example adds two buttons to the web page to download the visible chart image and the complete PDF report. These buttons use
JsChartViewer.partialUpdateAsAttachment to generate the download attachment requests.
The code on the server side needs to handle 4 kinds of requests:
- Initial request: The server will return the complete web page with the chart.
- Partial update request: This occurs when the chart is zoomed in/out of scrolled. They are generated using JsChartViewer.partialUpdate on the browser side. The server returns the updated chart and track cursor using WebChartViewer.partialUpdateChart.
- Download chart image request: This is generated on the browser side using JsChartViewer.partialUpdateAsAttachment. The server will use WebChartViewer.streamChart to send the chart image to the browser, with a flag set in the HTTP header to indicate it is an attachment. The browser should then save the chart image as a file download.
- Download PDF report request: This is generated on the browser side using JsChartViewer.partialUpdateAsAttachment. A flag is used to indicate that it is for the PDF report. The server will use a MultiPagePDF object to create the PDF report, and use WebChartViewer.streamChart to send the report to the browser, with a flag set in the HTTP header to indicate it is an attachment
MultiPagePDF works by generating a PDF page for chart added to it. The chart can be a
MultiChart, and can contain free form CDML text, tables, shape and images. In this way, MultiPagePDF can create complete PDF reports.
In this example, the PDF report is generated as follows:
- A new MultiPagePDF object is created.
- An empty PieChart object with custom CDML text in large bold font is added to the MultiPagePDF as the cover page. The PieChart is configured with the output options "pagewidth = 794; pageHeight = 1123" using BaseChart.setOutputOptions. As PDF defaults to 96dpi (dot per inch), the above sets the page to A4 size (210mm x 297mm).
- A loop is used to generate MultiChart objects as pages in the MultiPagePDF. Each MultiChart object will include a page heading at the top, and contain up to two XYChart objects, and with a page number at the bottom. Each XYChart object will plot one year of data. Like the cover page, the page is set to A4 size.
[Web Version (in ASP)] aspdemo\zoomscrollpdf.asp
<%@ language="vbscript" %>
<%
Set cd = CreateObject("ChartDirector.API")
'
' Create a random table for demo purpose.
'
Function getRanTable()
Set r = cd.RanTable(127, 4, 1827)
Call r.setDateCol(0, DateSerial(2015, 1, 1), 86400)
Call r.setCol(1, 150, -10, 10)
Call r.setCol(2, 200, -10, 10)
Call r.setCol(3, 250, -8, 8)
Set getRanTable = r
Exit Function
End Function
'
' Initialize the WebChartViewer when the page is first loaded
'
Sub initViewer(viewer)
' The full x-axis range is from Jan 1, 2007 to Jan 1, 2012
startDate = DateSerial(2015, 1, 1)
endDate = DateSerial(2020, 1, 1)
Call viewer.setFullRange("x", startDate, endDate)
' Initialize the view port to show the last 366 days (out of 1827 days)
viewer.ViewPortWidth = 366.0 / 1827
viewer.ViewPortLeft = 1 - viewer.ViewPortWidth
' Set the maximum zoom to 10 days (out of 1827 days)
viewer.ZoomInWidthLimit = 10.0 / 1827
End Sub
'
' Draw an XYChart using data from startX to endX
'
Function drawXYChart(startX, endX)
' Obtain the random data table
Set r = getRanTable()
' Select the data for the visible date range startDate to endDate. It is possible there is no
' data point at exactly startDate or endDate. In this case, we also need the data points that
' are just outside the visible date range to "overdraw" the line a little bit (the "overdrawn"
' part will be clipped to the plot area) In this demo, we do this by adding a one day margin to
' the date range when selecting the data. The selected data from the random data table
timeStamps = r.getCol(0)
dataSeriesA = r.getCol(1)
dataSeriesB = r.getCol(2)
dataSeriesC = r.getCol(3)
'
' At this stage, we have extracted the visible data. We can use those data to plot the chart.
'
'================================================================================
' Configure overall chart appearance.
'================================================================================
' Create an XYChart object of size 640 x 350 pixels
Set c = cd.XYChart(640, 350)
' Set the plotarea at (55, 50) with width 80 pixels less than chart width, and height 85 pixels
' less than chart height. Use a vertical gradient from light blue (f0f6ff) to sky blue (a0c0ff)
' as background. Set border to transparent and grid lines to white (ffffff).
Call c.setPlotArea(55, 50, c.getWidth() - 80, c.getHeight() - 85, c.linearGradientColor(0, 50, _
0, c.getHeight() - 35, &Hf0f6ff, &Ha0c0ff), -1, cd.Transparent, &Hffffff, &Hffffff)
' As the data can lie outside the plotarea in a zoomed chart, we need enable clipping.
Call c.setClipping()
' Add a legend box at (55, 25) using horizontal layout. Use 8pts Arial Bold as font. Set the
' background and border color to Transparent and use line style legend key.
Set b = c.addLegend(55, 25, False, "Arial Bold", 8)
Call b.setBackground(cd.Transparent)
Call b.setLineStyleKey()
' Set the axis stem to transparent
Call c.xAxis().setColors(cd.Transparent)
Call c.yAxis().setColors(cd.Transparent)
' Add axis title using 10pts Arial Bold Italic font
Call c.yAxis().setTitle("Ionic Temperature (C)", "Arial Bold Italic", 10)
'================================================================================
' Add data to chart
'================================================================================
'
' In this example, we represent the data by lines. You may modify the code below to use other
' representations (areas, scatter plot, etc).
'
' Add a line layer for the lines, using a line width of 2 pixels
Set layer = c.addLineLayer2()
Call layer.setLineWidth(2)
' In this demo, we do not have too many data points. In real code, the chart may contain a lot
' of data points when fully zoomed out - much more than the number of horizontal pixels in this
' plot area. So it is a good idea to use fast line mode.
Call layer.setFastLineMode()
' Now we add the 3 data series to a line layer, using the color red (ff33333), green (008800)
' and blue (3333cc)
Call layer.setXData(timeStamps)
Call layer.addDataSet(dataSeriesA, &Hff3333, "Alpha")
Call layer.addDataSet(dataSeriesB, &H008800, "Beta")
Call layer.addDataSet(dataSeriesC, &H3333cc, "Gamma")
'================================================================================
' Configure axis scale and labelling
'================================================================================
' Set the x-axis scale
Call c.xAxis().setDateScale(startX, endX)
'
' In this demo, the time range can be from a few years to a few days. We demonstrate how to set
' up different date/time format based on the time range.
'
' If all ticks are yearly aligned, then we use "yyyy" as the label format.
Call c.xAxis().setFormatCondition("align", 360 * 86400)
Call c.xAxis().setLabelFormat("{value|yyyy}")
' If all ticks are monthly aligned, then we use "mmm yyyy" in bold font as the first label of a
' year, and "mmm" for other labels.
Call c.xAxis().setFormatCondition("align", 30 * 86400)
Call c.xAxis().setMultiFormat(cd.StartOfYearFilter(), "<*font=bold*>{value|mmm yyyy}", _
cd.AllPassFilter(), "{value|mmm}")
' If all ticks are daily algined, then we use "mmm dd<*br*>yyyy" in bold font as the first label
' of a year, and "mmm dd" in bold font as the first label of a month, and "dd" for other labels.
Call c.xAxis().setFormatCondition("align", 86400)
Call c.xAxis().setMultiFormat(cd.StartOfYearFilter(), _
"<*block,halign=left*><*font=bold*>{value|mmm dd<*br*>yyyy}", cd.StartOfMonthFilter(), _
"<*font=bold*>{value|mmm dd}")
Call c.xAxis().setMultiFormat2(cd.AllPassFilter(), "{value|dd}")
' For all other cases (sub-daily ticks), use "hh:nn<*br*>mmm dd" for the first label of a day,
' and "hh:nn" for other labels.
Call c.xAxis().setFormatCondition("else")
Call c.xAxis().setMultiFormat(cd.StartOfDayFilter(), "<*font=bold*>{value|hh:nn<*br*>mmm dd}", _
cd.AllPassFilter(), "{value|hh:nn}")
Set drawXYChart = c
Exit Function
End Function
'
' Draw the chart
'
Sub drawChart(viewer)
' Determine the visible x-axis range
viewPortStartDate = cd.NTime(viewer.getValueAtViewPort("x", viewer.ViewPortLeft))
viewPortEndDate = cd.NTime(viewer.getValueAtViewPort("x", viewer.ViewPortRight))
' Draw the XYChart
Set c = drawXYChart(viewPortStartDate, viewPortEndDate)
' Add a title to the chart using 18 pts Times New Roman Bold Italic font
Call c.addTitle(" PDF Report Demonstration", "Times New Roman Bold Italic", 18)
If viewer.IsAttachmentRequest Then
' Output as PNG attachment
Call viewer.setChart(c, cd.PNG)
Else
' Output the chart
Call viewer.setChart(c, cd.SVG)
' Output Javascript chart model to the browser to support tracking cursor
viewer.ChartModel = c.getJsChartModel()
End If
End Sub
'
' Create a multi-page PDF Report
'
Function createPdfReport(viewer)
' The MultiPagePDF object can create PDF from multiple pages, each with one chart object. Since
' a chart object can contain text (eg. using BaseChart.addText) and other charts (eg. using
' MultiChart), that means each page can contain text and multiple charts.
Set doc = cd.MultiPagePDF()
' Page configuration - A4 = 210 x 297mm. The PDF default is 96 dpi (dot per inch), so the A4
' size is equal to 794 x 1123 dots.
pageConfig = "pagewidth = 794; pageheight = 1123"
' In this example, we include a cover page with only text. This is by creating an empty pie
' chart with text only.
Set firstPage = cd.PieChart(720, 960)
Call firstPage.addText(360, 320, _
"<*size=50*>ChartDirector<*br*><*size=30*>PDF Report Demonstration<*/*>", "Arial Bold", _
30, &H000000, cd.Center)
Call firstPage.setOutputOptions(pageConfig)
Call doc.addPage(firstPage)
' We include 2 charts per page, with each chart showing one year of data. Each page will also
' have a header and page number
startYear = Int(cd.getChartYMD(viewer.getValueAtViewPort("x", 0)) / 10000)
endYear = Int(cd.getChartYMD(viewer.getValueAtViewPort("x", 1) - 1) / 10000)
pageNumber = 0
For yyyy = startYear To endYear Step 2
' This chart is the page.
Set m = cd.MultiChart(760, 920)
' Use addTitle to add a header
Call m.addTitle("ChartDirector PDF Report Demonstration", "Arial Bold", 20)
' Create the first chart
Set c = drawXYChart(DateSerial(yyyy, 1, 1), DateSerial(yyyy + 1, 1, 1))
Call m.addChart(Int((m.getWidth() - c.getWidth()) / 2), 100, c)
Call c.addTitle("Year " & yyyy)
Set c2 = Nothing
If yyyy < endYear Then
' Create the second chart
Set c2 = drawXYChart(DateSerial(yyyy + 1, 1, 1), DateSerial(yyyy + 2, 1, 1))
Call c2.addTitle("Year " & (yyyy + 1))
Call m.addChart(Int((m.getWidth() - c2.getWidth()) / 2), 500, c2)
End If
' Add the page number
pageNumber = pageNumber + 1
Call m.addTitle2(cd.BottomCenter, CStr(pageNumber), "Arial Bold", 8)
Call m.setOutputOptions(pageConfig)
Call doc.addPage(m)
Next
' Output the PDF report
createPdfReport = doc.outPDF2()
End Function
' Create the WebChartViewer object
Set viewer = cd.WebChartViewer(Request, "chart1")
If viewer.IsAttachmentRequest Then
If Request("download") = "report" Then
Call viewer.streamChart2(Response, createPdfReport(viewer), "chartdirector_report.pdf")
Else
Call drawChart(viewer)
Call viewer.streamChart(Response, "demo_chart.png")
End If
Call Response.End
End If
If viewer.IsPartialUpdateRequest Then
' Draw the chart and perform a partial response.
Call drawChart(viewer)
Call Response.Write(viewer.partialUpdateChart())
Call Response.End
End If
'
' If the code reaches here, it is a full page request.
'
' In this exapmle, we just need to initialize the WebChartViewer and draw the chart.
Call initViewer(viewer)
Call drawChart(viewer)
%>
<!DOCTYPE html>
<html>
<head>
<title>PDF Report Demonstration</title>
<script type="text/javascript" src="cdjcv.js"></script>
<style type="text/css">
.chartButton { font:12px Verdana; border-bottom:#000000 1px solid; padding:5px; cursor:pointer;}
.chartButtonSpacer { font:12px Verdana; border-bottom:#000000 1px solid; padding:5px;}
.chartButton:hover { box-shadow:inset 0px 0px 0px 2px #444488; }
.chartButtonPressed { background-color: #CCFFCC; }
</style>
</head>
<body style="margin:0px;">
<script type="text/javascript">
//
// Execute the following initialization code after the web page is loaded
//
JsChartViewer.addEventListener(window, 'load', function() {
// Update the chart when the view port has changed (eg. when the user zooms in using the mouse)
var viewer = JsChartViewer.get('<%=viewer.Id%>');
viewer.attachHandler("ViewPortChanged", viewer.partialUpdate);
// Draw track cursor when mouse is moving over plotarea. Hide it when mouse leaves plot area.
viewer.attachHandler(["MouseMovePlotArea", "TouchStartPlotArea", "TouchMovePlotArea", "PostUpdate",
"ChartMove"], function(e) {
this.preventDefault(e); // Prevent the browser from using touch events for other actions
trackLineLabel(viewer, viewer.getPlotAreaMouseX());
viewer.setAutoHide("all", ["MouseOutPlotArea", "TouchEndPlotArea"]);
});
});
//
// Draw track line with data labels
//
function trackLineLabel(viewer, mouseX)
{
// Remove all previously drawn tracking object
viewer.hideObj("all");
// The chart and its plot area
var c = viewer.getChart();
var plotArea = c.getPlotArea();
// Get the data x-value that is nearest to the mouse, and find its pixel coordinate.
var xValue = c.getNearestXValue(mouseX);
var xCoor = c.getXCoor(xValue);
// Draw a vertical track line at the x-position
viewer.drawVLine("trackLine", xCoor, plotArea.getTopY(), plotArea.getBottomY(), "black 1px dotted");
// Draw a label on the x-axis to show the track line position
viewer.showTextBox("xAxisLabel", xCoor, plotArea.getBottomY() + 4, JsChartViewer.Top,
c.xAxis().getFormattedLabel(xValue, "mmm dd, yyyy"),
"font:bold 11px Arial;color:#FFFFFF;background-color:#000000;padding:0px 3px");
// Iterate through all layers to draw the data labels
for (var i = 0; i < c.getLayerCount(); ++i)
{
var layer = c.getLayerByZ(i);
// The data array index of the x-value
var xIndex = layer.getXIndexOf(xValue);
// Iterate through all the data sets in the layer
for (var j = 0; j < layer.getDataSetCount(); ++j)
{
var dataSet = layer.getDataSetByZ(j);
// Get the color and position of the data label
var color = dataSet.getDataColor();
var yCoor = c.getYCoor(dataSet.getPosition(xIndex), dataSet.getUseYAxis());
// Draw a track dot with a label next to it for visible data points in the plot area
if ((yCoor != null) && (yCoor >= plotArea.getTopY()) && (yCoor <= plotArea.getBottomY()) &&
(color != null))
{
viewer.showTextBox("dataPoint" + i + "_" + j, xCoor, yCoor, JsChartViewer.Center,
viewer.htmlRect(7, 7, color));
viewer.showTextBox("dataLabel" + i + "_" + j, xCoor + 5, yCoor, JsChartViewer.Left,
dataSet.getValue(xIndex).toPrecision(4), "padding:0px 3px;font:bold 11px Arial;" +
"background-color:" + color + ";color:#FFFFFF;-webkit-text-size-adjust:100%;");
}
}
}
}
//
// This method is called when the user clicks on the Pointer, Zoom In or Zoom Out buttons
//
function setMouseMode(mode)
{
var viewer = JsChartViewer.get('<%=viewer.Id%>');
if (mode == viewer.getMouseUsage())
mode = JsChartViewer.Default;
// Set the button color based on the selected mouse mode
document.getElementById("scrollButton").className = "chartButton" +
((mode == JsChartViewer.Scroll) ? " chartButtonPressed" : "");
document.getElementById("zoomInButton").className = "chartButton" +
((mode == JsChartViewer.ZoomIn) ? " chartButtonPressed" : "");
document.getElementById("zoomOutButton").className = "chartButton" +
((mode == JsChartViewer.ZoomOut) ? " chartButtonPressed" : "");
// Set the mouse mode
viewer.setMouseUsage(mode);
}
</script>
<form method="post" id="ZoomScrollPDF" runat="server">
<table cellspacing="0" cellpadding="0" style="border:black 1px solid;">
<tr>
<td align="right" colspan="2" style="background:#000088; color:#ffff00; padding:0px 4px 2px 0px;">
<a style="color:#FFFF00; font:italic bold 10pt Arial; text-decoration:none" href="http://www.advsofteng.com/">
Advanced Software Engineering
</a>
</td>
</tr>
<tr valign="top">
<td style="width:130px; background:#c0c0ff;">
<div style="width:130px">
<!-- The following table is to create 3 cells for 3 buttons to control the mouse usage mode. -->
<table style="width:100%; padding:0px; border:0px; border-spacing:0px;">
<tr>
<td class="chartButton" id="scrollButton" onclick="setMouseMode(JsChartViewer.Scroll)"
ontouchstart="this.onclick(event); event.preventDefault();">
<img src="scrollew.gif" style="vertical-align:middle" alt="Drag" /> Drag to Scroll
</td>
</tr>
<tr>
<td class="chartButton" id="zoomInButton" onclick="setMouseMode(JsChartViewer.ZoomIn)"
ontouchstart="this.onclick(event); event.preventDefault();">
<img src="zoomInIcon.gif" style="vertical-align:middle" alt="Zoom In" /> Zoom In
</td>
</tr>
<tr>
<td class="chartButton" id="zoomOutButton" onclick="setMouseMode(JsChartViewer.ZoomOut)"
ontouchstart="this.onclick(event); event.preventDefault();">
<img src="zoomOutIcon.gif" style="vertical-align:middle" alt="Zoom Out" /> Zoom Out
</td>
</tr>
</table>
<div style="margin-top:30px; text-align:center">
<input type="button" value="Download Chart" style="width:100%;height:2em"
onclick="JsChartViewer.get('<%=viewer.Id%>').partialUpdateAsAttachment('download=chart');" />
<input type="button" value="PDF Report" style="margin-top:5px; width:100%;height:2em"
onclick="JsChartViewer.get('<%=viewer.Id%>').partialUpdateAsAttachment('download=report');" />
</div>
</div>
</td>
<td style="border-left:black 1px solid; padding:10px 5px 0px 5px;">
<!-- ****** Here is the chart image ****** -->
<%=viewer.renderHTML()%>
</td>
</tr>
</table>
</form>
</body>
</html>
© 2021 Advanced Software Engineering Limited. All rights reserved.