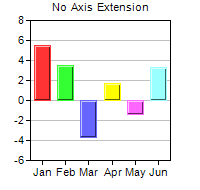
This example demonstrates how to control auto-scaling.
By default, ChartDirector auto-scales all axes. The
Axis.setAutoScale method controls the top extension, bottom extension and the zero affinity parameters that ChartDirector uses during auto-scaling. The first two parameters determine the amount of top and bottom margins to reserve during auto-scaling, while the last parameter determines when the axis should start from the origin (0).
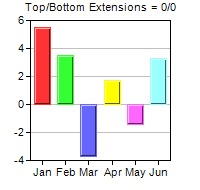
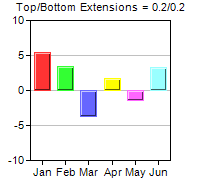
The first 3 charts demonstrate the effects of different top/bottom extensions.
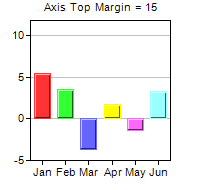
The 4th chart demonstrates that one could exclude a segment on the ends of an axis from scaling using
Axis.setMargin.
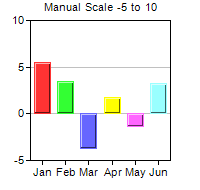
The 5th chart demonstrates manual scaling instead of auto-scaling. In manual scaling, the axis scale is explicitly provided by using
Axis.setLinearScale,
Axis.setLinearScale2,
Axis.setLogScale,
Axis.setLogScale2,
Axis.setDateScale or
Axis.setDateScale2.
The following is the command line version of the code in "cppdemo/axisscale". The MFC version of the code is in "mfcdemo/mfcdemo". The Qt Widgets version of the code is in "qtdemo/qtdemo". The QML/Qt Quick version of the code is in "qmldemo/qmldemo".
#include "chartdir.h"

void createChart(int chartIndex, const char *filename)
{
    // The data for the chart
    double data[] = {5.5, 3.5, -3.7, 1.7, -1.4, 3.3};
    const int data_size = (int)(sizeof(data)/sizeof(*data));
    const char* labels[] = {"Jan", "Feb", "Mar", "Apr", "May", "Jun"};
    const int labels_size = (int)(sizeof(labels)/sizeof(*labels));

    // Create a XYChart object of size 200 x 190 pixels
    XYChart* c = new XYChart(200, 190);

    // Set the plot area at (30, 20) and of size 140 x 140 pixels
    c->setPlotArea(30, 20, 140, 140);

    // Configure the axis as according to the input parameter
    if (chartIndex == 0) {
        c->addTitle("No Axis Extension", "Arial", 8);
    } else if (chartIndex == 1) {
        c->addTitle("Top/Bottom Extensions = 0/0", "Arial", 8);
        // Reserve 20% margin at top of plot area when auto-scaling
        c->yAxis()->setAutoScale(0, 0);
    } else if (chartIndex == 2) {
        c->addTitle("Top/Bottom Extensions = 0.2/0.2", "Arial", 8);
        // Reserve 20% margin at top and bottom of plot area when auto-scaling
        c->yAxis()->setAutoScale(0.2, 0.2);
    } else if (chartIndex == 3) {
        c->addTitle("Axis Top Margin = 15", "Arial", 8);
        // Reserve 15 pixels at top of plot area
        c->yAxis()->setMargin(15);
    } else {
        c->addTitle("Manual Scale -5 to 10", "Arial", 8);
        // Set the y axis to scale from -5 to 10, with ticks every 5 units
        c->yAxis()->setLinearScale(-5, 10, 5);
    }

    // Set the labels on the x axis
    c->xAxis()->setLabels(StringArray(labels, labels_size));

    // Add a color bar layer using the given data. Use a 1 pixel 3D border for the bars.
    c->addBarLayer(DoubleArray(data, data_size), IntArray(0, 0))->setBorderColor(-1, 1);

    // Output the chart
    c->makeChart(filename);

    //free up resources
    delete c;

}

int main(int argc, char *argv[])
{
    createChart(0, "axisscale0.png");
    createChart(1, "axisscale1.png");
    createChart(2, "axisscale2.png");
    createChart(3, "axisscale3.png");
    createChart(4, "axisscale4.png");
    return 0;
}
© 2023 Advanced Software Engineering Limited. All rights reserved.