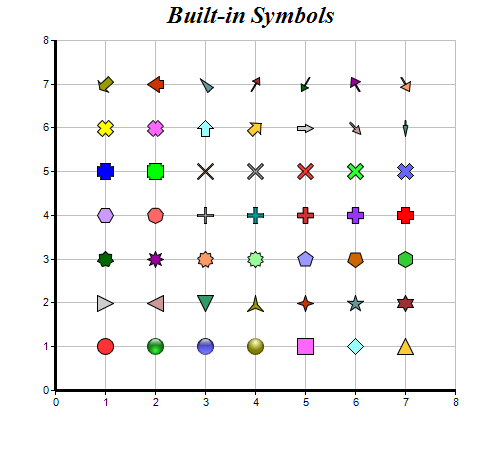
This example demonstrates the built-in symbols supported by ChartDirector.
ChartDirector 7.1 (C++ Edition)
Built-In Symbols
Source Code Listing
#include "chartdir.h"

int main(int argc, char *argv[])
{
    // Some ChartDirector built-in symbols
    int symbols[] = {Chart::CircleShape, Chart::GlassSphereShape, Chart::GlassSphere2Shape,
        Chart::SolidSphereShape, Chart::SquareShape, Chart::DiamondShape, Chart::TriangleShape,
        Chart::RightTriangleShape, Chart::LeftTriangleShape, Chart::InvertedTriangleShape,
        Chart::StarShape(3), Chart::StarShape(4), Chart::StarShape(5), Chart::StarShape(6),
        Chart::StarShape(7), Chart::StarShape(8), Chart::StarShape(9), Chart::StarShape(10),
        Chart::PolygonShape(5), Chart::Polygon2Shape(5), Chart::PolygonShape(6),
        Chart::Polygon2Shape(6), Chart::Polygon2Shape(7), Chart::CrossShape(0.1), Chart::CrossShape(
        0.2), Chart::CrossShape(0.3), Chart::CrossShape(0.4), Chart::CrossShape(0.5),
        Chart::CrossShape(0.6), Chart::CrossShape(0.7), Chart::Cross2Shape(0.1), Chart::Cross2Shape(
        0.2), Chart::Cross2Shape(0.3), Chart::Cross2Shape(0.4), Chart::Cross2Shape(0.5),
        Chart::Cross2Shape(0.6), Chart::Cross2Shape(0.7), Chart::ArrowShape(), Chart::ArrowShape(45
        ), Chart::ArrowShape(90, 0.5), Chart::ArrowShape(135, 0.5, 0.2), Chart::ArrowShape(180, 0.3,
        0.2, 0.3), Chart::ArrowShape(225, 1, 0.5, 0.7), Chart::ArrowShape(270, 1, 0.5, 0.25),
        Chart::ArrowShape(315, 0.5, 0.5, 0), Chart::ArrowShape(30, 0.5, 0.1, 0.6),
        Chart::ArrowShape(210, 0.5, 0.1, 0.6), Chart::ArrowShape(330, 0.7, 0.1), Chart::ArrowShape(
        150, 0.7, 0.1)};
    const int symbols_size = (int)(sizeof(symbols)/sizeof(*symbols));

    // Create a XYChart object of size 500 x 450 pixels
    XYChart* c = new XYChart(500, 450);

    // Set the plotarea at (55, 40) and of size 400 x 350 pixels, with a light grey border
    // (0xc0c0c0). Turn on both horizontal and vertical grid lines with light grey color (0xc0c0c0)
    c->setPlotArea(55, 40, 400, 350, -1, -1, 0xc0c0c0, 0xc0c0c0, -1);

    // Add a title to the chart using 18pt Times Bold Itatic font.
    c->addTitle("Built-in Symbols", "Times New Roman Bold Italic", 18);

    // Set the axes line width to 3 pixels
    c->xAxis()->setWidth(3);
    c->yAxis()->setWidth(3);

    // Ensure the ticks are at least 1 unit part (integer ticks)
    c->xAxis()->setMinTickInc(1);
    c->yAxis()->setMinTickInc(1);

    // Add each symbol as a separate scatter layer.
    for(int i = 0; i < symbols_size; ++i) {
        double xCoor[] = {i % 7 + 1.0};
        double yCoor[] = {i / 7 + 1.0};
        c->addScatterLayer(DoubleArray(xCoor, 1), DoubleArray(yCoor, 1), "", symbols[i], 17);
    }

    // Output the chart
    c->makeChart("builtinsymbols.png");

    //free up resources
    delete c;

    return 0;
}