
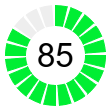
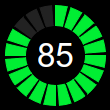
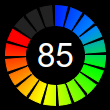
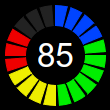
This example demonstrates circular bar meters in segmented style.
This example is similar to the Circular Bar Meter example except that the ring sectors are segmented.
ChartDirector 7.1 (C++ Edition)
Circular Bar Meter (2)
Source Code Listing
#include "chartdir.h"
void createChart(int chartIndex, const char *filename)
{
// The value to display on the meter
double value = 85;
// The meter radius and angle
int radius = 50;
double angle = value * 360.0 / 100;
// Create an AngularMeter with transparent background
AngularMeter* m = new AngularMeter(radius * 2 + 10, radius * 2 + 10, Chart::Transparent);
// Set the center, radius and angular range of the meter
m->setMeter(m->getWidth() / 2, m->getHeight() / 2, radius, 0, 360);
// For circular bar meters, we do not need pointer or graduation, so we hide them.
m->setMeterColors(Chart::Transparent, Chart::Transparent, Chart::Transparent);
m->setCap(0, Chart::Transparent);
// In this example, the circular bar has 20 segments
int segmentCount = 20;
// The angular step
double angleStep = 360.0 / segmentCount;
// The gap between segments is 4.5 degrees
double angleGap = 4.5;
//
// This example demonstrates several coloring styles
//
// Thd default fill and blank colors
int fillColor = 0x336699;
int blankColor = 0xeeeeee;
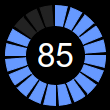
if (chartIndex >= 4) {
// Use dark background style
m->setColors(Chart::whiteOnBlackPalette);
fillColor = 0x6699ff;
blankColor = 0x222222;
}
if (chartIndex % 4 == 1) {
// Alternative fill color
fillColor = 0x00ee33;
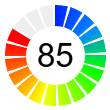
} else if (chartIndex % 4 == 2) {
// Use a smooth color scale as the fill color
int smoothColorScale[] = {0, 0x0022ff, 15, 0x0088ff, 30, 0x00ff00, 55, 0xffff00, 80,
0xff0000, 100, 0xff0000};
const int smoothColorScale_size = (int)(sizeof(smoothColorScale)/sizeof(*smoothColorScale));
fillColor = m->getDrawArea()->angleGradientColor(m->getWidth() / 2, m->getHeight() / 2, 0,
360, radius, radius - 20, IntArray(smoothColorScale, smoothColorScale_size));
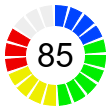
} else if (chartIndex % 4 == 3) {
// Use a step color scale as the fill color
int stepColorScale[] = {0, 0x0044ff, 20, 0x00ee00, 50, 0xeeee00, 70, 0xee0000, 100};
const int stepColorScale_size = (int)(sizeof(stepColorScale)/sizeof(*stepColorScale));
fillColor = m->getDrawArea()->angleGradientColor(m->getWidth() / 2, m->getHeight() / 2,
-angleGap / 2, 360 - angleGap / 2, radius, radius - 20, IntArray(stepColorScale,
stepColorScale_size));
}
//
// Now we draw the segments of the bar meter
//
// The segment that contains the value
int currentSegment = (int)(angle / angleStep);
// Segments after the current segment is colored with the blank color
for(int i = currentSegment + 1; i < segmentCount; ++i) {
m->addRingSector(radius, radius - 20, i * angleStep, (i + 1) * angleStep - angleGap,
blankColor);
}
// Segments before the current segment is colored with the fill color
for(int i = 0; i < currentSegment; ++i) {
m->addRingSector(radius, radius - 20, i * angleStep, (i + 1) * angleStep - angleGap,
fillColor);
}
// Segment that contains the angle will be partially filled and partially blank. We need to
// adjust the angle to compensated for the angle gap.
double adjustedAngle = currentSegment * angleStep + (angle - currentSegment * angleStep) * (1 -
angleGap / angleStep);
// The blank part of the segment
if ((currentSegment + 1) * angleStep > angle) {
m->addRingSector(radius, radius - 20, adjustedAngle, (currentSegment + 1) * angleStep -
angleGap, blankColor);
}
// The filled part of the segment.
if (angle > currentSegment * angleStep) {
m->addRingSector(radius, radius - 20, currentSegment * angleStep, adjustedAngle, fillColor);
}
// Add a label at the center to display the value
m->addText(m->getWidth() / 2, m->getHeight() / 2, m->formatValue(value, "{value}"), "Arial", 25,
Chart::TextColor, Chart::Center)->setMargin(0);
// Output the chart
m->makeChart(filename);
//free up resources
delete m;
}
int main(int argc, char *argv[])
{
createChart(0, "circularbarmeter20.png");
createChart(1, "circularbarmeter21.png");
createChart(2, "circularbarmeter22.png");
createChart(3, "circularbarmeter23.png");
createChart(4, "circularbarmeter24.png");
createChart(5, "circularbarmeter25.png");
createChart(6, "circularbarmeter26.png");
createChart(7, "circularbarmeter27.png");
return 0;
}