This example is the same as Simple Bar Chart (2), except that XYChart.addBarLayer3 is used to add a multi-color bar layer instead of a regular bar layer.
ChartDirector 7.1 (C++ Edition)
Multi-Color Bar Chart (1)
Source Code Listing
#include "chartdir.h"
int main(int argc, char *argv[])
{
// The data for the bar chart
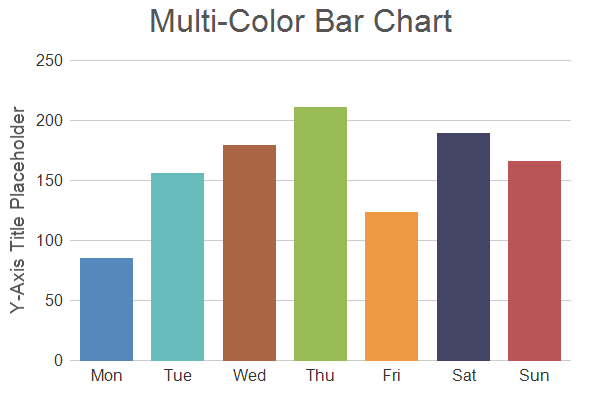
double data[] = {85, 156, 179, 211, 123, 189, 166};
const int data_size = (int)(sizeof(data)/sizeof(*data));
// The labels for the bar chart
const char* labels[] = {"Mon", "Tue", "Wed", "Thu", "Fri", "Sat", "Sun"};
const int labels_size = (int)(sizeof(labels)/sizeof(*labels));
// The colors for the bars
int colors[] = {0x5588bb, 0x66bbbb, 0xaa6644, 0x99bb55, 0xee9944, 0x444466, 0xbb5555};
const int colors_size = (int)(sizeof(colors)/sizeof(*colors));
// Create a XYChart object of size 600 x 400 pixels
XYChart* c = new XYChart(600, 400);
// Add a title box using grey (0x555555) 24pt Arial font
c->addTitle("Multi-Color Bar Chart", "Arial", 24, 0x555555);
// Set the plotarea at (70, 60) and of size 500 x 300 pixels, with transparent background and
// border and light grey (0xcccccc) horizontal grid lines
c->setPlotArea(70, 60, 500, 300, Chart::Transparent, -1, Chart::Transparent, 0xcccccc);
// Set the x and y axis stems to transparent and the label font to 12pt Arial
c->xAxis()->setColors(Chart::Transparent);
c->yAxis()->setColors(Chart::Transparent);
c->xAxis()->setLabelStyle("Arial", 12);
c->yAxis()->setLabelStyle("Arial", 12);
// Add a multi-color bar chart layer with transparent border using the given data
c->addBarLayer(DoubleArray(data, data_size), IntArray(colors, colors_size))->setBorderColor(
Chart::Transparent);
// Set the labels on the x axis.
c->xAxis()->setLabels(StringArray(labels, labels_size));
// For the automatic y-axis labels, set the minimum spacing to 40 pixels.
c->yAxis()->setTickDensity(40);
// Add a title to the y axis using dark grey (0x555555) 14pt Arial font
c->yAxis()->setTitle("Y-Axis Title Placeholder", "Arial", 14, 0x555555);
// Output the chart
c->makeChart("colorbar.png");
//free up resources
delete c;
return 0;
}