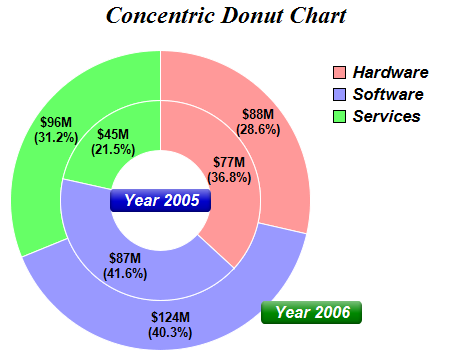
This example demonstrates creating concentric donut chart by merging two donuts of different radii.
The chart in this example is created as two separate
PieChart objects. The first PieChart represents the outer donut chart and the overall structure of the chart (such as the legend box, chart title, etc). The second PieChart has a
Transparent background and represents the inner donut chart. The two charts are merged together by using the
DrawArea.merge method.
The following is the command line version of the code in "cppdemo/concentric". The MFC version of the code is in "mfcdemo/mfcdemo". The Qt Widgets version of the code is in "qtdemo/qtdemo". The QML/Qt Quick version of the code is in "qmldemo/qmldemo".
#include "chartdir.h"

int main(int argc, char *argv[])
{
    // Data for outer ring
    double data[] = {88, 124, 96};
    const int data_size = (int)(sizeof(data)/sizeof(*data));

    // Data for inner ring
    double data2[] = {77, 87, 45};
    const int data2_size = (int)(sizeof(data2)/sizeof(*data2));

    // Labels for the sectors
    const char* labels[] = {"Hardware", "Software", "Services"};
    const int labels_size = (int)(sizeof(labels)/sizeof(*labels));

    // Colors for the sectors
    int colors[] = {0xff9999, 0x9999ff, 0x66ff66};
    const int colors_size = (int)(sizeof(colors)/sizeof(*colors));

    //
    // Create the main chart, which contains the chart title, the outer ring, and the legend box
    //

    // Create a PieChart object of size 450 x 360 pixels, with transparent background
    PieChart* c = new PieChart(450, 360);

    // Add a title to the chart with 18pt Times Bold Italic font
    c->addTitle("Concentric Donut Chart", "Times New Roman Bold Italic", 18);

    // Set donut center at (160, 200), and outer/inner radii as 150/100 pixels
    c->setDonutSize(160, 200, 150, 100);

    // Add a label at the bottom-right corner of the ring to label the outer ring Use 12pt Arial
    // Bold Italic font in white (ffffff) color, on a green (008800) background, with soft lighting
    // effect and 5 pixels rounded corners
    TextBox* t = c->addText(260, 300, " Year 2006 ", "Arial Bold Italic", 12, 0xffffff);
    t->setBackground(0x008800, Chart::Transparent, Chart::softLighting());
    t->setRoundedCorners(5);

    // Set the legend box at (320, 50) with 12pt Arial Bold Italic font, with no border
    c->addLegend(320, 50, true, "Arial Bold Italic", 13)->setBackground(Chart::Transparent,
        Chart::Transparent);

    // Set the pie data and the pie labels
    c->setData(DoubleArray(data, data_size), StringArray(labels, labels_size));

    // Set the pie colors
    c->setColors(Chart::DataColor, IntArray(colors, colors_size));

    // Set pie border color to white (ffffff)
    c->setLineColor(0xffffff);

    // Set pie label to value in $###M format, percentage in (##.#%) format, in two lines.
    c->setLabelFormat("${value}M<*br*>({percent|1}%)");

    // Use 10pt Airal Bold for the sector labels
    c->setLabelStyle("Arial Bold", 10);

    // Set the label position to -25 pixels from the sector (which would be internal to the sector)
    c->setLabelPos(-25);

    //
    // Create the inner ring.
    //

    // Create a PieChart object of size 280 x 320 pixels, with transparent background
    PieChart* c2 = new PieChart(280, 320, Chart::Transparent);

    // Set donut center at (110, 110), and outer/inner radii as 100/50 pixels
    c2->setDonutSize(110, 110, 100, 50);

    // Add a label at the center of the ring to label the inner ring. Use 12pt Arial Bold Italic
    // font in white (ffffff) color, on a deep blue (0000cc) background, with soft lighting effect
    // and 5 pixels rounded corners
    TextBox* t2 = c2->addText(110, 110, " Year 2005 ", "Arial Bold Italic", 12, 0xffffff,
        Chart::Center);
    t2->setBackground(0x0000cc, Chart::Transparent, Chart::softLighting());
    t2->setRoundedCorners(5);

    // Set the pie data and the pie labels
    c2->setData(DoubleArray(data2, data2_size), StringArray(labels, labels_size));

    // Set the pie colors
    c2->setColors(Chart::DataColor, IntArray(colors, colors_size));

    // Set pie border color to white (ffffff)
    c2->setLineColor(0xffffff);

    // Set pie label to value in $###M format, percentage in (##.#%) format, in two lines.
    c2->setLabelFormat("${value}M<*br*>({percent|1}%)");

    // Use 10pt Airal Bold for the sector labels
    c2->setLabelStyle("Arial Bold", 10);

    // Set the label position to -25 pixels from the sector (which would be internal to the sector)
    c2->setLabelPos(-25);

    // merge the inner ring into the outer ring at (50, 90)
    c->makeChart()->merge(c2->makeChart(), 50, 90, Chart::TopLeft, 0);

    // Output the chart
    c->makeChart("concentric.png");

    //free up resources
    delete c;
    delete c2;

    return 0;
}
© 2023 Advanced Software Engineering Limited. All rights reserved.