[MFC version] mfcdemo/ContourCrossSectionDlg.cpp
// CContourCrossSectionDlg.cpp : implementation file
//
#include "stdafx.h"
#include "mfcdemo.h"
#include "ContourCrossSectionDlg.h"
#include <vector>
#include <algorithm>
#include <assert.h>
#ifdef _DEBUG
#define new DEBUG_NEW
#endif
//
// Constructor
//
CContourCrossSectionDlg::CContourCrossSectionDlg(CWnd* pParent)
: CDialogEx(IDD_CONTOURCROSSSECTION, pParent)
{
m_ContourLayer = 0;
m_crossHairX = 0;
m_crossHairY = 0;
m_isDragging = Drag_None;
m_dragOffset = 0;
SetBackgroundColor(0x00FFFFFF);
}
//
// Destructor
//
CContourCrossSectionDlg::~CContourCrossSectionDlg()
{
delete m_ChartViewer.getChart();
delete m_CrossSectionViewerX.getChart();
delete m_CrossSectionViewerY.getChart();
}
void CContourCrossSectionDlg::DoDataExchange(CDataExchange* pDX)
{
CDialogEx::DoDataExchange(pDX);
DDX_Control(pDX, IDC_ChartViewer, m_ChartViewer);
DDX_Control(pDX, IDC_CrossSectionViewerX, m_CrossSectionViewerX);
DDX_Control(pDX, IDC_CrossSectionViewerY, m_CrossSectionViewerY);
}
BEGIN_MESSAGE_MAP(CContourCrossSectionDlg, CDialogEx)
ON_CONTROL(CVN_MouseMoveChart, IDC_ChartViewer, OnMouseMoveChart)
END_MESSAGE_MAP()
//
// Initialization
//
BOOL CContourCrossSectionDlg::OnInitDialog()
{
CDialogEx::OnInitDialog();
drawChart(&m_ChartViewer);
return TRUE;
}
//
// Draw the chart
//
void CContourCrossSectionDlg::drawChart(CChartViewer* viewer)
{
// The x and y coordinates of the grid
double dataX[] = { 0, 1, 2, 3, 4, 5, 6, 7, 8, 9, 10 };
const int dataX_len = (int)(sizeof(dataX) / sizeof(*dataX));
double dataY[] = { 0, 1, 2, 3, 4, 5, 6, 7, 8, 9, 10 };
const int dataY_len = (int)(sizeof(dataX) / sizeof(*dataX));
std::vector<double> dataZ(dataX_len * dataY_len);
// Pseudo-random data for he z-coordinates
double pi = acos(-1);
for (int iY = 0; iY < dataY_len; ++iY)
{
double y = dataY[iY];
double ay = 11 * cos(iY * pi * 2 / (dataY_len - 1) + 1.1673);
for (int iX = 0; iX < dataX_len; ++iX)
{
double x = dataX[iX];
double ax = 11 * cos(iX * pi * 2 / (dataX_len - 1) + 0.8629);
dataZ[iY * dataX_len + iX] = 20 + ((ax + 0.43) * sin(y) + (ay + 0.9166) * sin(x)
+ 0.0998) * sin((1 + fabs(x) / 10.0) * (1 + fabs(y) / 10.0) * 0.6667);
}
}
// Create a XYChart object of size 575 x 525 pixels
XYChart* c = new XYChart(575, 525);
// Set the plotarea at (75, 40) and of size 450 x 450 pixels. Use semi-transparent black
// (af000000) dotted lines for both horizontal and vertical grid lines
PlotArea* p = c->setPlotArea(75, 30, 450, 450, -1, -1, -1, c->dashLineColor((int)0xaf000000,
Chart::DotLine), -1);
// Set the chart and axis titles
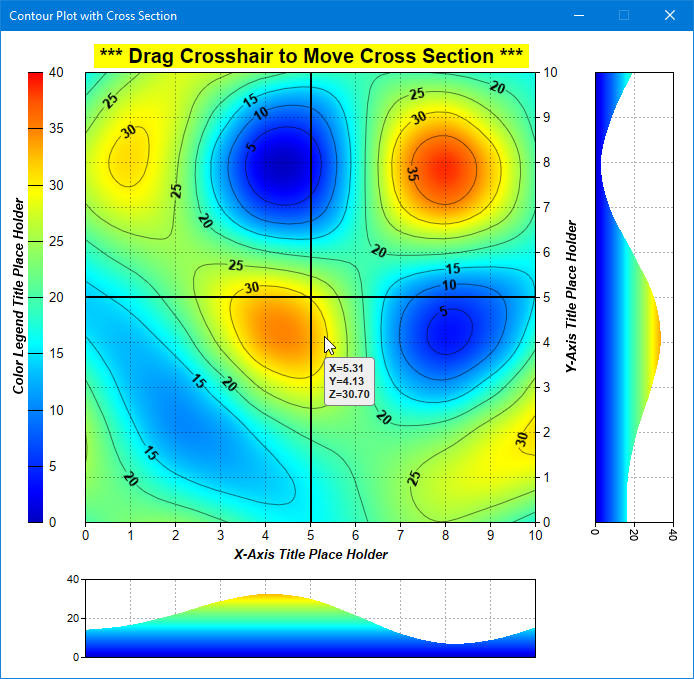
c->addTitle(" <*block,bgcolor=FFFF00*> *** Drag Crosshair to Move Cross Section *** <*/*>",
"Arial Bold", 15);
c->xAxis()->setTitle("X-Axis Title Place Holder", "Arial Bold Italic", 10);
c->yAxis()->setTitle("Y-Axis Title Place Holder", "Arial Bold Italic", 10);
// Put the y-axis on the right side of the chart
c->setYAxisOnRight();
// Set x-axis and y-axis labels to use 10pt Arial font
c->xAxis()->setLabelStyle("Arial", 10);
c->yAxis()->setLabelStyle("Arial", 10);
// When auto-scaling, use tick spacing of 40 pixels as a guideline
c->yAxis()->setTickDensity(40);
c->xAxis()->setTickDensity(40);
// Add a contour layer using the given data
m_ContourLayer = c->addContourLayer(DoubleArray(dataX, dataX_len),
DoubleArray(dataY, dataY_len), DoubleArray(&dataZ[0], (int)dataZ.size()));
// Enable contour label using 10pt Arial Bold font
m_ContourLayer->setContourLabelFormat("<*font=Arial Bold,size=10*>{value}<*/font*>");
// Move the grid lines in front of the contour layer
c->getPlotArea()->moveGridBefore(m_ContourLayer);
// Add a vertical color axis (the legend) at x = 0 at the same y-position as the plot area.
ColorAxis* cAxis = m_ContourLayer->setColorAxis(0, p->getTopY(), Chart::TopLeft,
p->getHeight(), Chart::Right);
// Use continuous gradient coloring (as opposed to step colors)
cAxis->setColorGradient(true);
// Add a title to the color axis using 10pt Arial Bold Italic font
cAxis->setTitle("Color Legend Title Place Holder", "Arial Bold Italic", 10);
// Set color axis labels to use 10pt Arial font
cAxis->setLabelStyle("Arial", 10);
// Set the chart image to the WinChartViewer
viewer->setChart(c);
// Tooltip for the contour chart
viewer->setImageMap(c->getHTMLImageMap("", "",
"title='<*cdml*><*font=Arial Bold*>X={x|2}\nY={y|2}\nZ={z|2}'"));
// Initializse the crosshair position to the center of the chart
m_crossHairX = p->getLeftX() + p->getWidth() / 2;
m_crossHairY = p->getTopY() + p->getHeight() / 2;
// Draw the cross section and crosshair
drawCrossSectionX(&m_CrossSectionViewerX);
drawCrossSectionY(&m_CrossSectionViewerY);
drawCrossHair(viewer);
}
//
// Draw the X cross section
//
void CContourCrossSectionDlg::drawCrossSectionX(CChartViewer* viewer)
{
// Get data of the vertical cross section data at the given x coordinate
XYChart* mainChart = (XYChart*)m_ChartViewer.getChart();
PlotArea* p = mainChart->getPlotArea();
DoubleArray z = m_ContourLayer->getCrossSection(m_crossHairX, p->getBottomY(), m_crossHairX,
p->getTopY());
// Create XYChat of the same height as the main chart. Align the plot area with that of the
// main chart.
XYChart* c = new XYChart(100, mainChart->getHeight());
c->setPlotArea(10, p->getTopY(), c->getWidth() - 22, p->getHeight(), -1, -1, -1,
c->dashLineColor((int)0xaf000000, Chart::DotLine), -1);
// The vertical chart will have the x-axis vertical and y-axis horizontal. Synchroinze the
// vertical axis (x-axis) with the y-axis of the main chart. Synchroinze the horizontal
// axis (y-axis) with the color axis.
c->swapXY();
c->xAxis()->syncAxis(mainChart->yAxis());
c->yAxis()->syncScale(m_ContourLayer->colorAxis());
// The vertical axis (x-axis) does not need labels as it is aligned with the main chart y-axis.
c->xAxis()->setLabelStyle("normal", 8, Chart::Transparent);
// Rotate the horizontal axis (y-axis) labels by 270 degrees
c->yAxis()->setLabelStyle("normal", 8, Chart::TextColor, 270);
// Add an area layer using the cross section data and the color scale of the color axis.
int scaleColor = c->yScaleColor(m_ContourLayer->colorAxis()->getColorScale());
AreaLayer* layer = c->addAreaLayer(z, scaleColor);
layer->setBorderColor(Chart::SameAsMainColor);
layer->setXData(mainChart->getYValue(p->getBottomY()), mainChart->getYValue(p->getTopY()));
// Display the chart
delete viewer->getChart();
viewer->setChart(c);
}
//
// Draw the Y cross section
//
void CContourCrossSectionDlg::drawCrossSectionY(CChartViewer* viewer)
{
// Get the vertical horizontal section data at the given y coordinate
XYChart* mainChart = (XYChart*)m_ChartViewer.getChart();
PlotArea* p = mainChart->getPlotArea();
DoubleArray z = m_ContourLayer->getCrossSection(p->getLeftX(), m_crossHairY, p->getRightX(),
m_crossHairY);
// Create XYChat of the same width as the main chart. Align the plot area with that of the
// main chart.
XYChart* c = new XYChart(mainChart->getWidth(), 100);
c->setPlotArea(p->getLeftX(), 10, p->getWidth(), c->getHeight() - 22, -1, -1, -1,
c->dashLineColor((int)0xaf000000, Chart::DotLine), -1);
// Synchroinze the x-axis with the x-axis of the main chart. Synchroinze the y-axis with the
// color axis.
c->xAxis()->syncAxis(mainChart->xAxis());
c->yAxis()->syncScale(m_ContourLayer->colorAxis());
// The x-axis does not need labels as it is aligned with the main chart x-axis.
c->xAxis()->setLabelStyle("normal", 8, Chart::Transparent);
// Add an area layer using the cross section data and the color scale of the color axis.
int scaleColor = c->yScaleColor(m_ContourLayer->colorAxis()->getColorScale());
AreaLayer* layer = c->addAreaLayer(z, scaleColor);
layer->setBorderColor(Chart::SameAsMainColor);
layer->setXData(mainChart->getXValue(p->getLeftX()), mainChart->getXValue(p->getRightX()));
// Display the chart
delete viewer->getChart();
viewer->setChart(c);
}
//
// Draw the crosshair, which is just two straight lines
//
void CContourCrossSectionDlg::drawCrossHair(CChartViewer* viewer)
{
// Get the chart to draw the crosshair on.
XYChart* c = (XYChart*)viewer->getChart();
// The crosshair will be drawn on the dynamic layer of the chart.
DrawArea* d = c->initDynamicLayer();
// Add two lines across the plot area of the chart
PlotArea* p = c->getPlotArea();
d->line(m_crossHairX, p->getTopY(), m_crossHairX, p->getBottomY(), 0x000000, 2);
d->line(p->getLeftX(), m_crossHairY, p->getRightX(), m_crossHairY, 0x000000, 2);
// Update the display
viewer->updateDisplay();
}
//
// Handle mouse dragging of the crosshair
//
void CContourCrossSectionDlg::OnMouseMoveChart()
{
CChartViewer* viewer = &m_ChartViewer;
int mouseX = viewer->getChartMouseX();
int mouseY = viewer->getChartMouseY();
if ((GetKeyState(VK_LBUTTON) & 0x100) != 0)
{
//
// If the mouse is near the crosshair while the mouse button is pressed, then it is drag
// dragging the crosshair and we need to update the contour projection.
//
if ((m_isDragging == Drag_Vertical) && (m_crossHairX != mouseX - m_dragOffset))
{
// Is dragging the vertical crosshair line
m_crossHairX = viewer->getPlotAreaMouseX();
drawCrossSectionX(&m_CrossSectionViewerX);
drawCrossHair(viewer);
}
if ((m_isDragging == Drag_Horizontal) && (m_crossHairY != mouseY - m_dragOffset))
{
// Is dragging the horizontal crosshair line
m_crossHairY = viewer->getPlotAreaMouseY();
drawCrossSectionY(&m_CrossSectionViewerY);
drawCrossHair(viewer);
}
}
else
{
//
// If mouse is near the crosshair, it can drag it by pressing the mouse button.
//
if (abs(m_dragOffset = mouseX - m_crossHairX) <= 8)
m_isDragging = Drag_Vertical; // Mouse is a position to drag the vertical line
else if (abs(m_dragOffset = mouseY - m_crossHairY) <= 8)
m_isDragging = Drag_Horizontal; // Mouse is a position to drag the horizontal line
else
m_isDragging = Drag_None;
}
}
[Qt Widgets version] qtdemo/contourcrosssection.cpp
#include <math.h>
#include <QLabel>
#include <QCheckBox>
#include <QMouseEvent>
#include "contourcrosssection.h"
#include "chartdir.h"


//
// Constructor
//
ContourCrossSection::ContourCrossSection(QWidget *parent) :
    QDialog(parent)
{
    //
    // Set up the GUI
    //
    setStyleSheet("background-color:white;");
    setFixedSize(700, 650);
    setWindowTitle("Contour Cross Section");

    // Main Chart Viewer
    m_ChartViewer = new QChartViewer(this);
    m_ChartViewer->setGeometry(15, 15, 575, 525);
    connect(m_ChartViewer, SIGNAL(mouseMove(QMouseEvent *)), SLOT(onMouseMovePlotArea(QMouseEvent *)));

    // Chart Viewer for X Cross Section
    m_CrossSectionViewerX = new QChartViewer(this);
    m_CrossSectionViewerX->setGeometry(595, 15, 100, 525);

    // Chart Viewer for Y Cross Section
    m_CrossSectionViewerY = new QChartViewer(this);
    m_CrossSectionViewerY->setGeometry(15, 540, 570, 100);

    m_ContourLayer = 0;
    m_xTrackPosition = 0;
    m_yTrackPosition = 0;
    m_isDragging = Drag_None;
    m_dragOffset = 0;

    // Draw the Chart
    drawChart(m_ChartViewer);
}

//
// Destructor
//
ContourCrossSection::~ContourCrossSection()
{
    delete m_ChartViewer->getChart();
    delete m_CrossSectionViewerX->getChart();
    delete m_CrossSectionViewerY->getChart();
}

//
// Draw chart
//
void ContourCrossSection::drawChart(QChartViewer *viewer)
{
    //
    // The random data used in this example
    //
    double dataX[] = { 0, 1, 2, 3, 4, 5, 6, 7, 8, 9, 10 };
    const int dataX_len = (int)(sizeof(dataX) / sizeof(*dataX));
    double dataY[] = { 0, 1, 2, 3, 4, 5, 6, 7, 8, 9, 10 };
    const int dataY_len = (int)(sizeof(dataX) / sizeof(*dataX));
    std::vector<double> dataZ(dataX_len * dataY_len);

    double pi = acos(-1);
    for (int iY = 0; iY < dataY_len; ++iY)
    {
        double y = dataY[iY];
        double ay = 11 * cos(iY * pi * 2 / (dataY_len - 1) + 1.1673);
        for (int iX = 0; iX < dataX_len; ++iX)
        {
            double x = dataX[iX];
            double ax = 11 * cos(iX * pi * 2 / (dataX_len - 1) + 0.8629);
            dataZ[iY * dataX_len + iX] = 20 + ((ax + 0.43) * sin(y) + (ay + 0.9166) * sin(x)
                + 0.0998) * sin((1 + fabs(x) / 10.0) * (1 + fabs(y) / 10.0) * 0.6667);
        }
    }

    // Create a XYChart object of size 575 x 525 pixels
    XYChart* c = new XYChart(575, 525);

    // Set the plotarea at (75, 40) and of size 400 x 400 pixels. Use semi-transparent black
    // (80000000) dotted lines for both horizontal and vertical grid lines
    PlotArea* p = c->setPlotArea(75, 30, 450, 450, -1, -1, -1, c->dashLineColor((int)0xaf000000,
        Chart::DotLine), -1);

    // Set the chart and axis titles
    c->addTitle("     <*block,bgcolor=FFFF00*> *** Drag Crosshair to Move Cross Section *** <*/*>",
        "Arial Bold", 15);
    c->xAxis()->setTitle("X-Axis Title Place Holder", "Arial Bold Italic", 10);
    c->yAxis()->setTitle("Y-Axis Title Place Holder", "Arial Bold Italic", 10);

    // In this example, we put the y-axis on the right side of the chart
    c->setYAxisOnRight();

    // Set x-axis and y-axis labels to use 10pt Arial font
    c->xAxis()->setLabelStyle("Arial", 10);
    c->yAxis()->setLabelStyle("Arial", 10);

    // When auto-scaling, use tick spacing of 40 pixels as a guideline
    c->yAxis()->setTickDensity(40);
    c->xAxis()->setTickDensity(40);

    // Add a contour layer using the given data
    m_ContourLayer = c->addContourLayer(DoubleArray(dataX, dataX_len),
        DoubleArray(dataY, dataY_len), DoubleArray(&dataZ[0], (int)dataZ.size()));

    // Enable contour label using 10pt Arial Bold font
    m_ContourLayer->setContourLabelFormat("<*font=Arial Bold,size=10*>{value}<*/font*>");

    // Move the grid lines in front of the contour layer
    c->getPlotArea()->moveGridBefore(m_ContourLayer);

    // Add a vertical color axis (the legend) at x = 0 at the same y-position as the plot area.
    ColorAxis* cAxis = m_ContourLayer->setColorAxis(0, p->getTopY(), Chart::TopLeft,
        p->getHeight(), Chart::Right);
    // Use continuous gradient coloring (as opposed to step colors)
    cAxis->setColorGradient(true);

    // Add a title to the color axis using 12 points Arial Bold Italic font
    cAxis->setTitle("Color Legend Title Place Holder", "Arial Bold Italic", 10);

    // Set color axis labels to use Arial Bold font
    cAxis->setLabelStyle("Arial", 10);

    // Set the chart image to the WinChartViewer
    viewer->setChart(c);

    // Tooltip for the contour chart
    viewer->setImageMap(c->getHTMLImageMap("", "",
        "title='<*cdml*><*font=Arial Bold*>X={x|2}\nY={y|2}\nZ={z|2}'"));

    // Draw the cross section
    drawCrossSectionX(m_xTrackPosition = (p->getLeftX() + p->getRightX()) / 2);
    drawCrossSectionY(m_yTrackPosition = (p->getTopY() + p->getBottomY()) / 2);
    drawCrossHair(viewer);
}

//
// Draw the X cross section
//
void ContourCrossSection::drawCrossSectionX(int x)
{
    XYChart* c = (XYChart*)m_ChartViewer->getChart();
    drawCrossSectionX(m_CrossSectionViewerX, (XYChart*)m_ChartViewer->getChart(), m_ContourLayer, x);
    m_CrossSectionViewerX->updateDisplay();
}

void ContourCrossSection::drawCrossSectionX(QChartViewer* viewer, XYChart* mainChart,
    ContourLayer* contourLayer, int x)
{
    // Get the vertical cross section data at the given x coordinate
    PlotArea* p = mainChart->getPlotArea();
    DoubleArray z = contourLayer->getCrossSection(x, p->getBottomY(), x, p->getTopY());

    // Create XYChat of the same height as the main chart. Align the plot area with that of the
    // main chart.
    XYChart* c = new XYChart(100, mainChart->getHeight());
    c->setPlotArea(10, p->getTopY(), c->getWidth() - 22, p->getHeight(), -1, -1, -1,
        c->dashLineColor((int)0xaf000000, Chart::DotLine), -1);

    // The vertical chart will have the x-axis vertical and y-axis horizontal. Synchroinze the
    // vertical axis (x-axis) with the y-axis of the main chart. Synchroinze the horizontal
    // axis (y-axis) with the color axis.
    c->swapXY();
    c->xAxis()->syncAxis(mainChart->yAxis());
    c->yAxis()->syncScale(contourLayer->colorAxis());

    // The vertical axis (x-axis) does not need labels as it is aligned with the main chart y-axis.
    c->xAxis()->setLabelStyle("normal", 8, Chart::Transparent);

    // Rotate the horizontal axis (y-axis) labels by 270 degrees
    c->yAxis()->setLabelStyle("normal", 8, Chart::TextColor, 270);

    // Add an area layer using the cross section data and the color scale of the color axis.
    AreaLayer* layer = c->addAreaLayer(z, c->yScaleColor(contourLayer->colorAxis()->getColorScale()));
    layer->setBorderColor(Chart::SameAsMainColor);
    layer->setXData(mainChart->getYValue(p->getBottomY()), mainChart->getYValue(p->getTopY()));

    // Display the chart
    delete viewer->getChart();
    viewer->setChart(c);
}

//
// Draw the Y cross section
//
void ContourCrossSection::drawCrossSectionY(int y)
{
    drawCrossSectionY(m_CrossSectionViewerY, (XYChart*)m_ChartViewer->getChart(), m_ContourLayer, y);
    m_CrossSectionViewerY->updateDisplay();
}

void ContourCrossSection::drawCrossSectionY(QChartViewer* viewer, XYChart* mainChart,
    ContourLayer* contourLayer, int y)
{
    // Get the vertical horizontal section data at the given y coordinate
    PlotArea* p = mainChart->getPlotArea();
    DoubleArray z = contourLayer->getCrossSection(p->getLeftX(), y, p->getRightX(), y);

    // Create XYChat of the same width as the main chart. Align the plot area with that of the
    // main chart.
    XYChart* c = new XYChart(mainChart->getWidth(), 100);
    c->setPlotArea(p->getLeftX(), 10, p->getWidth(), c->getHeight() - 22, -1, -1, -1,
        c->dashLineColor((int)0xaf000000, Chart::DotLine), -1);

    // Synchroinze the x-axis with the x-axis of the main chart. Synchroinze the y-axis with the
    // color axis.
    c->xAxis()->syncAxis(mainChart->xAxis());
    c->yAxis()->syncScale(contourLayer->colorAxis());

    // The x-axis does not need labels as it is aligned with the main chart x-axis.
    c->xAxis()->setLabelStyle("normal", 8, Chart::Transparent);

    AreaLayer* layer = c->addAreaLayer(z, c->yScaleColor(contourLayer->colorAxis()->getColorScale()));
    layer->setBorderColor(Chart::SameAsMainColor);
    layer->setXData(mainChart->getXValue(p->getLeftX()), mainChart->getXValue(p->getRightX()));

    // Display the chart
    delete viewer->getChart();
    viewer->setChart(c);
}

//
// Draw the crosshair, which is just two straight lines
//
void ContourCrossSection::drawCrossHair(QChartViewer* viewer)
{
    // Get the chart to draw the crosshair on.
    XYChart* c = (XYChart*)viewer->getChart();

    // The crosshair will be drawn on the dynamic layer of the chart.
    DrawArea* d = c->initDynamicLayer();

    // Add two lines across the plot area of the chart
    PlotArea* p = c->getPlotArea();
    d->line(m_xTrackPosition, p->getTopY(), m_xTrackPosition, p->getBottomY(), 0x000000, 2);
    d->line(p->getLeftX(), m_yTrackPosition, p->getRightX(), m_yTrackPosition, 0x000000, 2);

    // Update the display
    viewer->updateDisplay();
}

//
// Handle mouse dragging of the crosshair
//
void ContourCrossSection::onMouseMovePlotArea(QMouseEvent *event)
{
    QChartViewer* viewer = m_ChartViewer;
    XYChart* c = (XYChart*)viewer->getChart();
    PlotArea* p = c->getPlotArea();

    int mouseX = viewer->getChartMouseX();
    int mouseY = viewer->getChartMouseY();

    // Drag occurs if mouse is moving and mouse button is down
    if (event->buttons() & Qt::LeftButton)
    {
        //
        // If the mouse is near the crosshair while the mouse button is pressed, then it is drag
        // dragging the crosshair and we need to update the contour projection.
        //

        if ((m_isDragging == Drag_Vertical) && (m_xTrackPosition != mouseX - m_dragOffset))
        {
            // Is dragging the vertical crosshair line
            m_xTrackPosition = (std::max)(p->getLeftX(), (std::min)(p->getRightX(), mouseX - m_dragOffset));
            drawCrossSectionX(m_xTrackPosition);
            drawCrossHair(viewer);
        }

        if ((m_isDragging == Drag_Horizontal) && (m_yTrackPosition != mouseY - m_dragOffset))
        {
            // Is dragging the horizontal crosshair line
            m_yTrackPosition = (std::max)(p->getTopY(), (std::min)(p->getBottomY(), mouseY - m_dragOffset));
            drawCrossSectionY(m_yTrackPosition);
            drawCrossHair(viewer);
        }
    }
    else
    {
        //
        // If mouse is near the crosshair, it can drag it by pressing the mouse button.
        //
        if (abs(m_dragOffset = mouseX - m_xTrackPosition) <= 8)
            m_isDragging = Drag_Vertical;   // Mouse is a position to drag the vertical line
        else if (abs(m_dragOffset = mouseY - m_yTrackPosition) <= 8)
            m_isDragging = Drag_Horizontal; // Mouse is a position to drag the horizontal line
        else
            m_isDragging = Drag_None;
    }
}
© 2023 Advanced Software Engineering Limited. All rights reserved.