[Qt Widgets version] qtdemo/contourzoomscroll.cpp
#include "contourzoomscroll.h"
#include <QPushButton>
#include <QFileDialog>
#include <math.h>
ContourZoomScroll::ContourZoomScroll(QWidget *parent) :
QDialog(parent)
{
setWindowTitle("Contour Plot Zoom/Scroll");
setFixedSize(680, 500);
QFrame *frame = new QFrame(this);
frame->setGeometry(4, 4, 120, 492);
frame->setFrameShape(QFrame::StyledPanel);
// Pointer push button
QPushButton *pointerPB = new QPushButton(QIcon(":/icons/scroll_icon.png"), "Scroll", frame);
pointerPB->setGeometry(4, 8, 112, 28);
pointerPB->setStyleSheet("QPushButton { text-align:left; padding:5px}");
pointerPB->setCheckable(true);
// Zoom In push button
QPushButton *zoomInPB = new QPushButton(QIcon(":/icons/zoomin_icon.png"), "Zoom In", frame);
zoomInPB->setGeometry(4, 36, 112, 28);
zoomInPB->setStyleSheet("QPushButton { text-align:left; padding:5px}");
zoomInPB->setCheckable(true);
// Zoom Out push button
QPushButton *zoomOutPB = new QPushButton(QIcon(":/icons/zoomout_icon.png"), "Zoom Out", frame);
zoomOutPB->setGeometry(4, 64, 112, 28);
zoomOutPB->setStyleSheet("QPushButton { text-align:left; padding:5px}");
zoomOutPB->setCheckable(true);
// Save push button
QPushButton *savePB = new QPushButton(QIcon(":/icons/save_icon.png"), "Save", frame);
savePB->setStyleSheet("QPushButton { text-align:left; padding:5px}");
savePB->setGeometry(4, 120, 112, 28);
connect(savePB, SIGNAL(clicked(bool)), SLOT(onSave(bool)));
// The Pointer/Zoom In/Zoom Out buttons form a button group
mouseUsage = new QButtonGroup(frame);
mouseUsage->addButton(pointerPB, Chart::MouseUsageScroll);
mouseUsage->addButton(zoomInPB, Chart::MouseUsageZoomIn);
mouseUsage->addButton(zoomOutPB, Chart::MouseUsageZoomOut);
connect(mouseUsage, SIGNAL(buttonPressed(QAbstractButton*)),
SLOT(onMouseUsageChanged(QAbstractButton*)));
// Zoom Mode label
QLabel *zoomModeLabel = new QLabel("Zoom Level", frame);
zoomModeLabel->setGeometry(6, 180, 110, 18);
zoomModeLabel->setAlignment(Qt::AlignHCenter);
// Zoom level bar
m_ZoomBar = new QSlider(Qt::Horizontal, frame);
m_ZoomBar->setGeometry(12, 205, 102, 41);
m_ZoomBar->setRange(1, 100);
m_ZoomBar->setTickPosition(QSlider::TicksBothSides);
m_ZoomBar->setInvertedAppearance(true);
connect(m_ZoomBar, SIGNAL(valueChanged(int)), SLOT(onZoomBarChanged(int)));
// Viewport Control
m_ViewPortControl = new QViewPortControl(frame);
m_ViewPortControl->setGeometry(QRect(5, 334, 112, 112));
// Chart Viewer
m_ChartViewer = new QChartViewer(this);
m_ChartViewer->setGeometry(QRect(132, 4, 500, 480));
connect(m_ChartViewer, SIGNAL(viewPortChanged()), SLOT(onViewPortChanged()));
//
// Initialize member variables
//
firstChart = 0;
firstColorAxis = 0;
// Set initial zoom/scroll direction
m_ChartViewer->setScrollDirection(Chart::DirectionHorizontalVertical);
m_ChartViewer->setZoomDirection(Chart::KeepAspectRatio);
// Initially set the mouse to drag to scroll mode
pointerPB->click();
// Enable mouse wheel zooming by setting the zoom ratio to 1.1 per wheel event
m_ChartViewer->setMouseWheelZoomRatio(1.1);
// Configure CDML tooltip to use a semi-transparent rounded rectangle as container and
// Arial Bold as font
m_ChartViewer->setCDMLToolTipPrefix(
"<*block,bgColor=60FFFFDD,roundedCorners=5,margin=5,edgeColor=000000*><*font=Arial Bold*>");
// Load the data
loadData();
// Can update chart now
m_ChartViewer->updateViewPort(true, true);
// Configure the CViewPortControl to use transparent black for region outside the viewport,
// that is, to darken the outside region.
m_ViewPortControl->setViewPortExternalColor(0x7f000000);
m_ViewPortControl->setViewPortBorderColor(0x7fffffff);
m_ViewPortControl->setSelectionBorderColor(0x7fffffff);
// Draw and display the full chart in the QViewPortControl
drawFullChart(m_ViewPortControl, m_ChartViewer);
// Bind the QChartViewer to the QViewPortControl
m_ViewPortControl->setViewer(m_ChartViewer);
}
ContourZoomScroll::~ContourZoomScroll()
{
// Delete the old chart in m_ChartViewer unless it is the first chart
if (m_ChartViewer->getChart() != firstChart)
delete m_ChartViewer->getChart();
// Delete the first chart
delete firstChart;
// Delete the chart in the m_ViewPortControl
delete m_ViewPortControl->getChart();
}
//
// The ViewPortChanged event handler. This event occurs if the user scrolls or zooms in or
// out the chart by dragging or clicking on the chart. It can also be triggered by calling
// QChartViewer.updateViewPort.
//
void ContourZoomScroll::onViewPortChanged()
{
// In addition to updating the chart, we may also need to update other controls that
// changes based on the view port.
updateControls(m_ChartViewer);
//
// Update chart and image map if necessary
//
if (m_ChartViewer->needUpdateChart())
drawChart(m_ChartViewer);
}
//
// Update other controls that may be affected by the viewport.
//
void ContourZoomScroll::updateControls(QChartViewer *viewer)
{
//
// Update the Zoom slider to reflect the current zoom level of the view port
//
double smallerSide = viewer->getViewPortWidth() > viewer->getViewPortHeight()
? viewer->getViewPortHeight() : viewer->getViewPortWidth();
m_ZoomBar->setValue((int)(smallerSide * m_ZoomBar->maximum() + 0.5));
}
//
// Load the data
//
void ContourZoomScroll::loadData()
{
//
// For simplicity, in this demo, we just use hard coded data.
//
// The x and y coordinates of the grid
double x[] = {-10, -9, -8, -7, -6, -5, -4, -3, -2, -1, 0, 1, 2, 3, 4, 5, 6, 7, 8, 9, 10};
double y[] = {-10, -9, -8, -7, -6, -5, -4, -3, -2, -1, 0, 1, 2, 3, 4, 5, 6, 7, 8, 9, 10};
dataX.assign(x, x + sizeof(x) / sizeof(*x));
dataY.assign(y, y + sizeof(y) / sizeof(*y));
// The values at the grid points. In this example, we will compute the values using the
// formula z = x * sin(y) + y * sin(x).
dataZ.resize(dataX.size() * dataY.size());
for (int yIndex = 0; yIndex < (int)dataY.size(); ++yIndex)
{
double y = dataY[yIndex];
for (int xIndex = 0; xIndex < (int)dataX.size(); ++xIndex)
{
double x = dataX[xIndex];
dataZ[yIndex * dataX.size() + xIndex] = x * sin(y) + y * sin(x);
}
}
}
//
// Draw the chart and display it in the given viewer
//
void ContourZoomScroll::drawChart(QChartViewer *viewer)
{
// Create an XYChart object 500 x 480 pixels in size, with the same background color
// as the container
XYChart *c = new XYChart(540, 490);
// Set the plotarea at (75, 40) and of size 400 x 400 pixels. Use semi-transparent black
// (80000000) dotted lines for both horizontal and vertical grid lines
c->setPlotArea(50, 40, 400, 400, -1, -1, -1, c->dashLineColor(0x80000000, Chart::DotLine), -1);
// Enable clipping mode to clip the part of the data that is outside the plot area.
c->setClipping();
// Add a title to the chart using 15 points Arial Bold Italic font
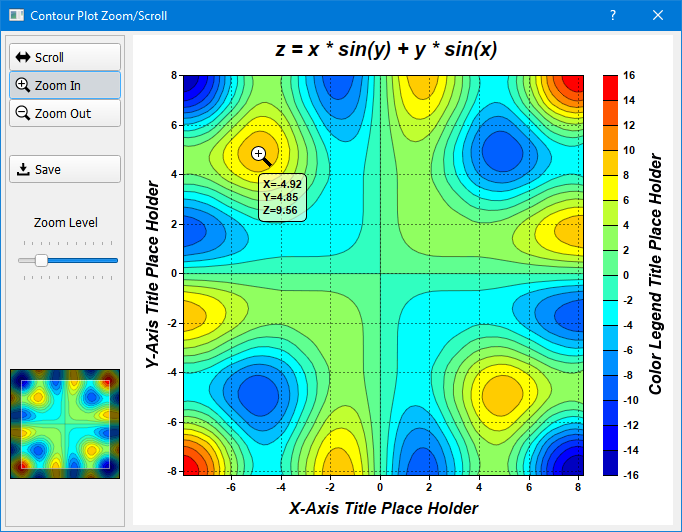
c->addTitle("z = x * sin(y) + y * sin(x) ", "Arial Bold Italic", 15);
// Set x-axis and y-axis title using 12 points Arial Bold Italic font
c->xAxis()->setTitle("X-Axis Title Place Holder", "Arial Bold Italic", 12);
c->yAxis()->setTitle("Y-Axis Title Place Holder", "Arial Bold Italic", 12);
// Set x-axis and y-axis labels to use Arial Bold font
c->xAxis()->setLabelStyle("Arial Bold");
c->yAxis()->setLabelStyle("Arial Bold");
// When auto-scaling, use tick spacing of 40 pixels as a guideline
c->yAxis()->setTickDensity(40);
c->xAxis()->setTickDensity(40);
// Add a contour layer using the given data
ContourLayer* layer = c->addContourLayer(vectorToArray(dataX), vectorToArray(dataY),
vectorToArray(dataZ));
// Move the grid lines in front of the contour layer
c->getPlotArea()->moveGridBefore(layer);
// Add a color axis (the legend) in which the top left corner is anchored at (505, 40). Set the
// length to 400 pixels and the labels on the right side.
ColorAxis* cAxis = layer->setColorAxis(470, 40, Chart::TopLeft, 400, Chart::Right);
// Add a title to the color axis using 12 points Arial Bold Italic font
cAxis->setTitle("Color Legend Title Place Holder", "Arial Bold Italic", 12)
->setAlignment(Chart::Right);
// Set color axis labels to use Arial Bold font
cAxis->setLabelStyle("Arial Bold");
// In this example, we have not explicitly configured the full x and y range. In this case,
// the first time syncLinearAxisWithViewPort is called, ChartDirector will auto-scale the axis
// and assume the resulting range is the full range. In subsequent calls, ChartDirector will
// set the axis range based on the view port and the full range.
viewer->syncLinearAxisWithViewPort("x", c->xAxis());
viewer->syncLinearAxisWithViewPort("y", c->yAxis());
// To ensure the color is consistent, we must keep the color axis the same scale when the
// user zooms or scorlls the chart. To do this, we save the color axis of the first chart.
// and synchronize all future charts with this color axis.
if (0 == firstChart)
{
// We need to save the first chart as well as the first color axis. Otherwise the first
// chart may get deleted, and this will delete the first color axis as well.
firstChart = c;
firstColorAxis = cAxis;
}
else
cAxis->syncAxis(firstColorAxis);
// Delete the old chart unless it is the first chart
if (viewer->getChart() != firstChart)
delete viewer->getChart();
// Display chart
viewer->setChart(c);
// Tooltip for the contour chart
viewer->setImageMap(c->getHTMLImageMap("", "", "title='<*cdml*>X={x|2}\nY={y|2}\nZ={z|2}'"));
}
//
// Draw the full thumbnail chart and display it in the given CViewPortControl
//
void ContourZoomScroll::drawFullChart(QViewPortControl *vpc, QChartViewer *viewer)
{
// Create an XYChart object 110 x 110 pixels in size
XYChart* c = new XYChart(110, 110);
// Set the plotarea to cover the entire chart. Disable grid lines by setting their colors
// to transparent.
c->setPlotArea(0, 0, c->getWidth() - 1, c->getHeight() - 1, -1, -1, -1, Chart::Transparent,
Chart::Transparent);
// Add a contour layer using the given data
ContourLayer* layer = c->addContourLayer(vectorToArray(dataX), vectorToArray(dataY),
vectorToArray(dataZ));
layer->setContourColor(0xcf000000);
//layer->colorAxis()->syncAxis(firstColorAxis);
// The x and y axis scales reflect the full range of the view port
c->xAxis()->setLinearScale(viewer->getValueAtViewPort("x", 0), viewer->getValueAtViewPort("x", 1),
Chart::NoValue);
c->yAxis()->setLinearScale(viewer->getValueAtViewPort("y", 0), viewer->getValueAtViewPort("y", 1),
Chart::NoValue);
// Set the chart image to the WinChartViewer
delete vpc->getChart();
vpc->setChart(c);
}
//
// The Pointer, Zoom In or Zoom out button is pressed
//
void ContourZoomScroll::onMouseUsageChanged(QAbstractButton *b)
{
m_ChartViewer->setMouseUsage(mouseUsage->id(b));
}
//
// The Save button is pressed
//
void ContourZoomScroll::onSave(bool)
{
QString fileName = QFileDialog::getSaveFileName(this, "Save", "chartdirector_demo",
"PNG (*.png);;JPG (*.jpg);;GIF (*.gif);;BMP (*.bmp);;SVG (*.svg);;PDF (*.pdf)");
if (!fileName.isEmpty())
{
// Save the chart
BaseChart *c = m_ChartViewer->getChart();
if (0 != c)
c->makeChart(fileName.toUtf8().constData());
}
}
//
// User moves the Zoom slider control
//
void ContourZoomScroll::onZoomBarChanged(int value)
{
if (!m_ChartViewer->isInViewPortChangedEvent())
{
// Remember the center point
double centerX = m_ChartViewer->getViewPortLeft() +
m_ChartViewer->getViewPortWidth() / 2;
double centerY = m_ChartViewer->getViewPortTop() +
m_ChartViewer->getViewPortHeight() / 2;
// Aspect ratio and zoom factor
double aspectRatio = m_ChartViewer->getViewPortWidth() /
m_ChartViewer->getViewPortHeight();
double zoomTo = ((double)value) / m_ZoomBar->maximum();
// Zoom by adjusting ViewPortWidth and ViewPortHeight while maintaining the aspect ratio
m_ChartViewer->setViewPortWidth(zoomTo * ((aspectRatio < 1) ? 1 : aspectRatio));
m_ChartViewer->setViewPortHeight(zoomTo * ((aspectRatio > 1) ? 1 : (1 / aspectRatio)));
// Adjust ViewPortLeft and ViewPortTop to keep center point unchanged
m_ChartViewer->setViewPortLeft(centerX - m_ChartViewer->getViewPortWidth() / 2);
m_ChartViewer->setViewPortTop(centerY - m_ChartViewer->getViewPortHeight() / 2);
// Update the chart image only, but no need to update the image map.
m_ChartViewer->updateViewPort(true, false);
}
}
//
// Convert std::vector to a DoubleArray
//
DoubleArray ContourZoomScroll::vectorToArray(std::vector<double> &v)
{
return (v.size() == 0) ? DoubleArray() : DoubleArray(&(v[0]), v.size());
}
[QML/Qt Quick version] qmldemo/contourzoomscroll.qml
import QtQuick
import QtQuick.Window
import QtQuick.Controls
import QtQuick.Dialogs
import advsofteng.com 1.0

Window {
    title: "Contour Plot Zoom/Scroll"
    width: 680
    height: 500
    visible: true
    modality: Qt.ApplicationModal

    Pane {
        id: leftPane
        width: 120
        padding: 5
        anchors.top: parent.top;
        anchors.bottom: parent.bottom;

        Column {

            Button {
                width: 110
                contentItem: Row {
                    padding: 2; leftPadding: 5
                    Image { source: "icons/scroll_icon.png"; width:16; height:16; }
                    Text { text: "  Pointer"; font.pixelSize: 12; }
                }
                checked: viewer.mouseUsage == QmlChartViewer.MouseUsageScroll
                onClicked: viewer.mouseUsage = QmlChartViewer.MouseUsageScroll
            }
            Button {
                width: 110
                contentItem: Row {
                    padding: 2; leftPadding: 5
                    Image { source: "icons/zoomin_icon.png"; width:16; height:16; }
                    Text { text: "  Zoom In"; font.pixelSize: 12; }
                }
                checked: viewer.mouseUsage == QmlChartViewer.MouseUsageZoomIn
                onClicked: viewer.mouseUsage = QmlChartViewer.MouseUsageZoomIn
            }
            Button {
                width: 110
                contentItem: Row {
                    padding: 2; leftPadding: 5
                    Image { source: "icons/zoomout_icon.png"; width:16; height:16; }
                    Text { text: "  Zoom Out"; font.pixelSize: 12; }
                }
                checked: viewer.mouseUsage == QmlChartViewer.MouseUsageZoomOut
                onClicked: viewer.mouseUsage = QmlChartViewer.MouseUsageZoomOut
            }

            // Spacer
            Item {width: 1; height: 30}

            Button {
                width: 110
                contentItem: Row {
                    padding: 2; leftPadding: 5
                    Image { source: "icons/save_icon.png"; width:16; height:16; }
                    Text { text: "  Save"; font.pixelSize: 12; }
                }
                onClicked: saveImageDialog.open()
            }

            // Spacer
            Item {width: 1; height: 50}

            Text {
                width: 100
                bottomPadding: 4
                text: "Zoom Level"
                horizontalAlignment: Text.AlignHCenter
            }
            Slider {
                id: zoomSlider
                width: 110
                onValueChanged: {
                    // The slider and viewport can update each others. To avoid infinite loop,
                    // the slider will update the viewport only if the viewport is not updating
                    // the slider.
                    if (viewer.isInViewPortChangedEvent) return;

                    // Remember the center point
                    var centerX = (viewer.viewPortLeft + viewer.viewPortRight) / 2;
                    var centerY = (viewer.viewPortTop + viewer.viewPortBottom) / 2;

                    // Aspect ratio and zoom factor
                    var aspectRatio = viewer.viewPortWidth / viewer.viewPortHeight;
                    var zoomTo = Math.max(0.01, value);

                    // Zoom by adjusting ViewPortWidth and ViewPortHeight while maintaining the aspect ratio
                    viewer.viewPortWidth = zoomTo * ((aspectRatio < 1) ? 1 : aspectRatio);
                    viewer.viewPortHeight = zoomTo * ((aspectRatio > 1) ? 1 : (1 / aspectRatio));

                    // Adjust ViewPortLeft and ViewPortTop to keep center point unchanged
                    viewer.viewPortLeft = centerX - viewer.viewPortWidth / 2;
                    viewer.viewPortTop = centerY - viewer.viewPortHeight / 2;

                    // Update the chart image only, but no need to update the image map.
                    viewer.updateViewPort(true, false);
                }
            }
        }

        QmlViewPortControl {
            id: vpCtrl;
            anchors.bottom: parent.bottom
            anchors.bottomMargin: 40
            width: 110
            height: 110

            // Bind the viewport control with the viewer
            viewer: viewer;
            // Set the viewport coloring scheme
            viewPortExternalColor: 0x7f000000
            viewPortBorderColor: 0x7fffffff
            selectionBorderColor: 0x7fffffff
        }
    }

    FileDialog {
        id: saveImageDialog
        title: "Save"
        currentFile: "chartdirector_demo"
        fileMode: FileDialog.SaveFile
        nameFilters: ["PNG (*.png);", "JPG (*.jpg)", "GIF (*.gif)", "BMP (*.bmp)", "SVG (*.svg)", "PDF (*.pdf)"]
        onAccepted: demo.saveChartImage(viewer, selectedFile)
    }

    QmlChartViewer
    {
        x: 130
        id: viewer

        // Set default mouse usage to scroll and mouse wheel to zoom. Use
        // bidirectional zoom/scroll.
        mouseUsage: QmlChartViewer.MouseUsageScroll
        mouseWheelZoomRatio: 1.1
        scrollDirection: QmlChartViewer.HorizontalVertical
        zoomDirection: QmlChartViewer.KeepAspectRatio

        // Configure the CDML tooltip container to use semi-transparent background and Arial Bold font
        cdmlToolTipPrefix: "<*block,bgColor=60FFFFDD,roundedCorners=5,margin=5,edgeColor=000000*><*font=Arial Bold*>"

        // Update chart on viewport change. Update the slider too.
        onViewPortChanged: {
            if (needUpdateChart) demo.drawChart(this);
            zoomSlider.value = Math.min(viewPortWidth, viewPortHeight)
        }
    }

    // The backend implementation of this demo.
    ContourZoomScroll {
        id: demo
    }

    Component.onCompleted: {
        demo.initChartViewer(viewer, vpCtrl);
        viewer.updateViewPort(true, true);
    }
}
[QML/Qt Quick version] qmldemo/contourzoomscroll.cpp
#include "contourzoomscroll.h"
#include <math.h>


//
// Utlity to convert std::vector to a DoubleArray
//
static DoubleArray vectorToArray(std::vector<double> &v)
{
    return (v.size() == 0) ? DoubleArray() : DoubleArray(&(v[0]), v.size());
}


ContourZoomScroll::ContourZoomScroll(QObject *parent) : QObject(parent)
{
    //
    // Initialize member variables
    //
    m_currentChart = 0;
    m_currentVpcChart = 0;
    m_firstChart = 0;
    m_firstColorAxis = 0;

    // Load the data
    loadData();
}

ContourZoomScroll::~ContourZoomScroll()
{
    // Delete the old chart in m_ChartViewer unless it is the first chart
    if (m_currentChart != m_firstChart)
        delete m_currentChart;

    // Delete the first chart
    delete m_firstChart;

    // Delete the chart in the m_ViewPortControl
    delete m_currentVpcChart;
}

//
// Load the data
//
void ContourZoomScroll::loadData()
{
    //
    // For simplicity, in this demo, we just use hard coded data.
    //
    // The x and y coordinates of the grid
    double x[] = {-10, -9, -8, -7, -6, -5, -4, -3, -2, -1, 0, 1, 2, 3, 4, 5, 6, 7, 8, 9, 10};
    double y[] = {-10, -9, -8, -7, -6, -5, -4, -3, -2, -1, 0, 1, 2, 3, 4, 5, 6, 7, 8, 9, 10};
    dataX.assign(x, x + sizeof(x) / sizeof(*x));
    dataY.assign(y, y + sizeof(y) / sizeof(*y));

    // The values at the grid points. In this example, we will compute the values using the
    // formula z = x * sin(y) + y * sin(x).
    dataZ.resize(dataX.size() * dataY.size());
    for (int yIndex = 0; yIndex < (int)dataY.size(); ++yIndex)
    {
        double y = dataY[yIndex];
        for (int xIndex = 0; xIndex < (int)dataX.size(); ++xIndex)
        {
            double x = dataX[xIndex];
            dataZ[yIndex * dataX.size() + xIndex] = x * sin(y) + y * sin(x);
        }
    }
}

void ContourZoomScroll::initChartViewer(QmlChartViewer *viewer, QmlViewPortControl *vpCtrl)
{
    // Trigger the ViewPortChanged event to draw the chart
    viewer->updateViewPort(true, true);

    // Draw and display the full chart in the CViewPortControl
    drawFullChart(vpCtrl);
}

//
// Draw the chart and display it in the given viewer
//
void ContourZoomScroll::drawChart(QmlChartViewer *viewer)
{
    // Create an XYChart object 500 x 480 pixels in size, with the same background color
    // as the container
    XYChart *c = new XYChart(540, 490);

    // Set the plotarea at (75, 40) and of size 400 x 400 pixels. Use semi-transparent black
    // (80000000) dotted lines for both horizontal and vertical grid lines
    c->setPlotArea(50, 40, 400, 400, -1, -1, -1, c->dashLineColor(0x80000000, Chart::DotLine), -1);

    // Enable clipping mode to clip the part of the data that is outside the plot area.
    c->setClipping();

    // Add a title to the chart using 15 points Arial Bold Italic font
    c->addTitle("z = x * sin(y) + y * sin(x)      ", "Arial Bold Italic", 15);

    // Set x-axis and y-axis title using 12 points Arial Bold Italic font
    c->xAxis()->setTitle("X-Axis Title Place Holder", "Arial Bold Italic", 12);
    c->yAxis()->setTitle("Y-Axis Title Place Holder", "Arial Bold Italic", 12);

    // Set x-axis and y-axis labels to use Arial Bold font
    c->xAxis()->setLabelStyle("Arial Bold");
    c->yAxis()->setLabelStyle("Arial Bold");

    // When auto-scaling, use tick spacing of 40 pixels as a guideline
    c->yAxis()->setTickDensity(40);
    c->xAxis()->setTickDensity(40);

    // Add a contour layer using the given data
    ContourLayer* layer = c->addContourLayer(vectorToArray(dataX), vectorToArray(dataY),
        vectorToArray(dataZ));

    // Move the grid lines in front of the contour layer
    c->getPlotArea()->moveGridBefore(layer);

    // Add a color axis (the legend) in which the top left corner is anchored at (505, 40). Set the
    // length to 400 pixels and the labels on the right side.
    ColorAxis* cAxis = layer->setColorAxis(470, 40, Chart::TopLeft, 400, Chart::Right);

    // Add a title to the color axis using 12 points Arial Bold Italic font
    cAxis->setTitle("Color Legend Title Place Holder", "Arial Bold Italic", 12)
        ->setAlignment(Chart::Right);

    // Set color axis labels to use Arial Bold font
    cAxis->setLabelStyle("Arial Bold");

    // In this example, we have not explicitly configured the full x and y range. In this case,
    // the first time syncLinearAxisWithViewPort is called, ChartDirector will auto-scale the axis
    // and assume the resulting range is the full range. In subsequent calls, ChartDirector will
    // set the axis range based on the view port and the full range.
    viewer->syncLinearAxisWithViewPort("x", c->xAxis());
    viewer->syncLinearAxisWithViewPort("y", c->yAxis());

    // To ensure the color is consistent, we must keep the color axis the same scale when the
    // user zooms or scorlls the chart. To do this, we save the color axis of the first chart.
    // and synchronize all future charts with this color axis.
    if (0 == m_firstChart)
    {
        // We need to save the first chart as well as the first color axis. Otherwise the first
        // chart may get deleted, and this will delete the first color axis as well.
        m_firstChart = c;
        m_firstColorAxis = cAxis;
    }
    else
        cAxis->syncAxis(m_firstColorAxis);

    // Delete the old chart unless it is the first chart
    if (viewer->getChart() != m_firstChart)
        delete viewer->getChart();

    // Display chart
    viewer->setChart(m_currentChart = c);

    // Tooltip for the contour chart
    viewer->setImageMap(c->getHTMLImageMap("", "", "title='<*cdml*>X={x|2}\nY={y|2}\nZ={z|2}'"));
}

//
// Draw the full thumbnail chart and display it in the given CViewPortControl
//
void ContourZoomScroll::drawFullChart(QmlViewPortControl *vpc)
{
    // Create an XYChart object 110 x 110 pixels in size
    XYChart* c = new XYChart(110, 110);

    // Set the plotarea to cover the entire chart. Disable grid lines by setting their colors
    // to transparent.
    c->setPlotArea(0, 0, c->getWidth() - 1, c->getHeight() - 1, -1, -1, -1, Chart::Transparent,
        Chart::Transparent);

    // Add a contour layer using the given data
    ContourLayer* layer = c->addContourLayer(vectorToArray(dataX), vectorToArray(dataY),
        vectorToArray(dataZ));
    layer->setContourColor(0xcf000000);

    if (m_firstColorAxis)
        layer->colorAxis()->syncAxis(m_firstColorAxis);

    // The x and y axis scales reflect the full range of the view port
    QmlChartViewer *viewer = vpc->getViewer();
    if (viewer)
    {
        c->xAxis()->setLinearScale(viewer->getValueAtViewPort("x", 0), viewer->getValueAtViewPort("x", 1),
            Chart::NoValue);
        c->yAxis()->setLinearScale(viewer->getValueAtViewPort("y", 0), viewer->getValueAtViewPort("y", 1),
            Chart::NoValue);
    }

    // Set the chart image to the WinChartViewer
    delete vpc->getChart();
    vpc->setChart(m_currentVpcChart = c);
}

//
// The Save button is pressed
//
void ContourZoomScroll::saveChartImage(QmlChartViewer *viewer, QUrl url)
{
    QString path = url.toLocalFile();
    if (!path.isEmpty())
    {
        // Save the chart
        BaseChart *c = viewer->getChart();
        if (0 != c)
            c->makeChart(path.toUtf8().constData());
    }
}
© 2023 Advanced Software Engineering Limited. All rights reserved.