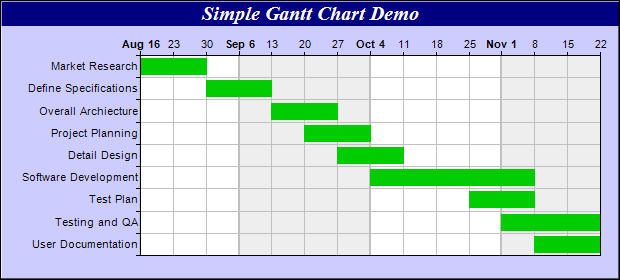
This example demonstrates a simple gantt chart.
This chart is created by using a horizontal box-whisker layer, in which only the "box" part of the box-whisker layer is used. Date/time values are used as box data, resulting in a gantt chart.
The key features demonstrated in this example are:
- Create the box-whisker layer using XYChart.addBoxWhiskerLayer, in which the data arrays are dates.
- Swap the x-axis and y-axis using XYChart.swapXY, so the chart is using a horizontal orientation.
- Use XYChart.setYAxisOnRight to move the y-axis to the opposite side of the plot area, so that the y-axis is at the top of the plot area. (Note: the "right" word on setYAxisOnRight means the "right" side before "swapXY" rotation. After rotation, the right side will become to top side.)
- Use Axis.setReverse to reverse the direction of the x-axis, so that the x-axis is vertical from top to bottom (instead of from bottom to top).
- Set the y-axis to date scale using Axis.setDateScale.
- Set multi-format axis labels for the y-axis using Axis.setMultiFormat. Note that the labels for the first week of the month are in bold, with the month name shown. The other labels just show the day.
- Use alternative background colors for the plot area by providing two background colors when calling XYChart.setPlotArea.
The following is the command line version of the code in "cppdemo/gantt". The MFC version of the code is in "mfcdemo/mfcdemo". The Qt Widgets version of the code is in "qtdemo/qtdemo". The QML/Qt Quick version of the code is in "qmldemo/qmldemo".
#include "chartdir.h"

int main(int argc, char *argv[])
{
    // data for the gantt chart, representing the start date, end date and names for various
    // activities
    double startDate[] = {Chart::chartTime(2004, 8, 16), Chart::chartTime(2004, 8, 30),
        Chart::chartTime(2004, 9, 13), Chart::chartTime(2004, 9, 20), Chart::chartTime(2004, 9, 27),
        Chart::chartTime(2004, 10, 4), Chart::chartTime(2004, 10, 25), Chart::chartTime(2004, 11, 1
        ), Chart::chartTime(2004, 11, 8)};
    const int startDate_size = (int)(sizeof(startDate)/sizeof(*startDate));
    double endDate[] = {Chart::chartTime(2004, 8, 30), Chart::chartTime(2004, 9, 13),
        Chart::chartTime(2004, 9, 27), Chart::chartTime(2004, 10, 4), Chart::chartTime(2004, 10, 11
        ), Chart::chartTime(2004, 11, 8), Chart::chartTime(2004, 11, 8), Chart::chartTime(2004, 11,
        22), Chart::chartTime(2004, 11, 22)};
    const int endDate_size = (int)(sizeof(endDate)/sizeof(*endDate));
    const char* labels[] = {"Market Research", "Define Specifications", "Overall Archiecture",
        "Project Planning", "Detail Design", "Software Development", "Test Plan", "Testing and QA",
        "User Documentation"};
    const int labels_size = (int)(sizeof(labels)/sizeof(*labels));

    // Create a XYChart object of size 620 x 280 pixels. Set background color to light blue
    // (ccccff), with 1 pixel 3D border effect.
    XYChart* c = new XYChart(620, 280, 0xccccff, 0x000000, 1);

    // Add a title to the chart using 15 points Times Bold Itatic font, with white (ffffff) text on
    // a deep blue (000080) background
    c->addTitle("Simple Gantt Chart Demo", "Times New Roman Bold Italic", 15, 0xffffff
        )->setBackground(0x000080);

    // Set the plotarea at (140, 55) and of size 460 x 200 pixels. Use alternative white/grey
    // background. Enable both horizontal and vertical grids by setting their colors to grey
    // (c0c0c0). Set vertical major grid (represents month boundaries) 2 pixels in width
    c->setPlotArea(140, 55, 460, 200, 0xffffff, 0xeeeeee, Chart::LineColor, 0xc0c0c0, 0xc0c0c0
        )->setGridWidth(2, 1, 1, 1);

    // swap the x and y axes to create a horziontal box-whisker chart
    c->swapXY();

    // Set the y-axis scale to be date scale from Aug 16, 2004 to Nov 22, 2004, with ticks every 7
    // days (1 week)
    c->yAxis()->setDateScale(Chart::chartTime(2004, 8, 16), Chart::chartTime(2004, 11, 22), 86400 *
        7);

    // Set multi-style axis label formatting. Month labels are in Arial Bold font in "mmm d" format.
    // Weekly labels just show the day of month and use minor tick (by using '-' as first character
    // of format string).
    c->yAxis()->setMultiFormat(Chart::StartOfMonthFilter(), "<*font=Arial Bold*>{value|mmm d}",
        Chart::StartOfDayFilter(), "-{value|d}");

    // Set the y-axis to shown on the top (right + swapXY = top)
    c->setYAxisOnRight();

    // Set the labels on the x axis
    c->xAxis()->setLabels(StringArray(labels, labels_size));

    // Reverse the x-axis scale so that it points downwards.
    c->xAxis()->setReverse();

    // Set the horizontal ticks and grid lines to be between the bars
    c->xAxis()->setTickOffset(0.5);

    // Add a green (33ff33) box-whisker layer showing the box only.
    c->addBoxWhiskerLayer(DoubleArray(startDate, startDate_size), DoubleArray(endDate, endDate_size
        ), DoubleArray(), DoubleArray(), DoubleArray(), 0x00cc00, Chart::SameAsMainColor,
        Chart::SameAsMainColor);

    // Output the chart
    c->makeChart("gantt.png");

    //free up resources
    delete c;

    return 0;
}
© 2023 Advanced Software Engineering Limited. All rights reserved.