This example demonstrates using bar gradient shading for a horizontal bar chart. It also demonstrates using gradient color background, partially rounded frame, and automatic resizing of the plot area to fit the chart.
The following is the command line version of the code in "cppdemo/gradientbar". The MFC version of the code is in "mfcdemo/mfcdemo". The Qt Widgets version of the code is in "qtdemo/qtdemo". The QML/Qt Quick version of the code is in "qmldemo/qmldemo".
#include "chartdir.h"
int main(int argc, char *argv[])
{
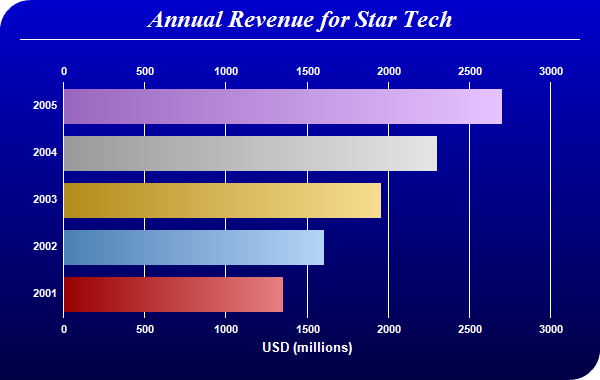
// The data for the bar chart
double data[] = {1350, 1600, 1950, 2300, 2700};
const int data_size = (int)(sizeof(data)/sizeof(*data));
// The labels for the bar chart
const char* labels[] = {"2001", "2002", "2003", "2004", "2005"};
const int labels_size = (int)(sizeof(labels)/sizeof(*labels));
// The colors for the bars
int colors[] = {0xcc0000, 0x66aaee, 0xeebb22, 0xcccccc, 0xcc88ff};
const int colors_size = (int)(sizeof(colors)/sizeof(*colors));
// Create a PieChart object of size 600 x 380 pixels.
XYChart* c = new XYChart(600, 380);
// Use the white on black palette, which means the default text and line colors are white
c->setColors(Chart::whiteOnBlackPalette);
// Use a vertical gradient color from blue (0000cc) to deep blue (000044) as background. Use
// rounded corners of 30 pixels radius for the top-left and bottom-right corners.
c->setBackground(c->linearGradientColor(0, 0, 0, c->getHeight(), 0x0000cc, 0x000044));
c->setRoundedFrame(0xffffff, 30, 0, 30, 0);
// Add a title using 18pt Times New Roman Bold Italic font. Add 6 pixels top and bottom margins
// to the title.
TextBox* title = c->addTitle("Annual Revenue for Star Tech", "Times New Roman Bold Italic", 18);
title->setMargin(0, 0, 6, 6);
// Add a separator line in white color just under the title
c->addLine(20, title->getHeight(), c->getWidth() - 21, title->getHeight(), 0xffffff);
// Tentatively set the plotarea at (70, 80) and of 480 x 240 pixels in size. Use transparent
// border and white grid lines
c->setPlotArea(70, 80, 480, 240, -1, -1, Chart::Transparent, 0xffffff);
// Swap the axis so that the bars are drawn horizontally
c->swapXY();
// Add a multi-color bar chart layer using the supplied data. Use bar gradient lighting with the
// light intensity from 0.75 to 2.0
c->addBarLayer(DoubleArray(data, data_size), IntArray(colors, colors_size))->setBorderColor(
Chart::Transparent, Chart::barLighting(0.75, 2.0));
// Set the labels on the x axis.
c->xAxis()->setLabels(StringArray(labels, labels_size));
// Show the same scale on the left and right y-axes
c->syncYAxis();
// Set the bottom y-axis title using 10pt Arial Bold font
c->yAxis()->setTitle("USD (millions)", "Arial Bold", 10);
// Set y-axes to transparent
c->yAxis()->setColors(Chart::Transparent);
c->yAxis2()->setColors(Chart::Transparent);
// Disable ticks on the x-axis by setting the tick color to transparent
c->xAxis()->setTickColor(Chart::Transparent);
// Set the label styles of all axes to 8pt Arial Bold font
c->xAxis()->setLabelStyle("Arial Bold", 8);
c->yAxis()->setLabelStyle("Arial Bold", 8);
c->yAxis2()->setLabelStyle("Arial Bold", 8);
// Adjust the plot area size, such that the bounding box (inclusive of axes) is 30 pixels from
// the left edge, 25 pixels below the title, 50 pixels from the right edge, and 25 pixels from
// the bottom edge.
c->packPlotArea(30, title->getHeight() + 25, c->getWidth() - 50, c->getHeight() - 25);
// Output the chart
c->makeChart("gradientbar.png");
//free up resources
delete c;
return 0;
}
© 2023 Advanced Software Engineering Limited. All rights reserved.