This example demonstrates creating a multi-color horizontal box-whisker chart.
XYChart.addBoxWhiskerLayer2 is used to create the multi-color box-whisker layer. The chart is set to horizontal orientation using XYChart.swapXY.
ChartDirector 7.1 (C++ Edition)
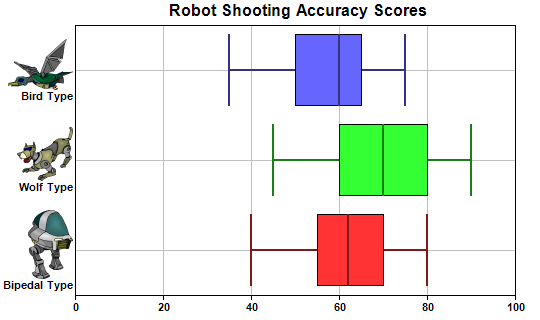
Horizontal Box-Whisker Chart
Source Code Listing
#include "chartdir.h"

int main(int argc, char *argv[])
{
    // Sample data for the Box-Whisker chart. Represents the minimum, 1st quartile, medium, 3rd
    // quartile and maximum values of some quantities
    double Q0Data[] = {40, 45, 35};
    const int Q0Data_size = (int)(sizeof(Q0Data)/sizeof(*Q0Data));
    double Q1Data[] = {55, 60, 50};
    const int Q1Data_size = (int)(sizeof(Q1Data)/sizeof(*Q1Data));
    double Q2Data[] = {62, 70, 60};
    const int Q2Data_size = (int)(sizeof(Q2Data)/sizeof(*Q2Data));
    double Q3Data[] = {70, 80, 65};
    const int Q3Data_size = (int)(sizeof(Q3Data)/sizeof(*Q3Data));
    double Q4Data[] = {80, 90, 75};
    const int Q4Data_size = (int)(sizeof(Q4Data)/sizeof(*Q4Data));

    // The labels for the chart
    const char* labels[] = {"<*img=robot1.png*><*br*>Bipedal Type",
        "<*img=robot2.png*><*br*>Wolf Type", "<*img=robot5.png*><*br*>Bird Type"};
    const int labels_size = (int)(sizeof(labels)/sizeof(*labels));

    // Create a XYChart object of size 540 x 320 pixels
    XYChart* c = new XYChart(540, 320);

    // swap the x and y axes to create a horizontal box-whisker chart
    c->swapXY();

    // Set the plotarea at (75, 25) and of size 440 x 270 pixels. Enable both horizontal and
    // vertical grids by setting their colors to grey (0xc0c0c0)
    c->setPlotArea(75, 25, 440, 270)->setGridColor(0xc0c0c0, 0xc0c0c0);

    // Add a title to the chart
    c->addTitle("           Robot Shooting Accuracy Scores");

    // Set the labels on the x axis and the font to Arial Bold
    c->xAxis()->setLabels(StringArray(labels, labels_size))->setFontStyle("Arial Bold");

    // Disable x axis ticks by setting the length to 0
    c->xAxis()->setTickLength(0);

    // Set the font for the y axis labels to Arial Bold
    c->yAxis()->setLabelStyle("Arial Bold");

    // Add a Box Whisker layer using light blue 0x9999ff as the fill color and blue (0xcc) as the
    // line color. Set the line width to 2 pixels
    c->addBoxWhiskerLayer2(DoubleArray(Q3Data, Q3Data_size), DoubleArray(Q1Data, Q1Data_size),
        DoubleArray(Q4Data, Q4Data_size), DoubleArray(Q0Data, Q0Data_size), DoubleArray(Q2Data,
        Q2Data_size))->setLineWidth(2);

    // Output the chart
    c->makeChart("hboxwhisker.png");

    //free up resources
    delete c;

    return 0;
}