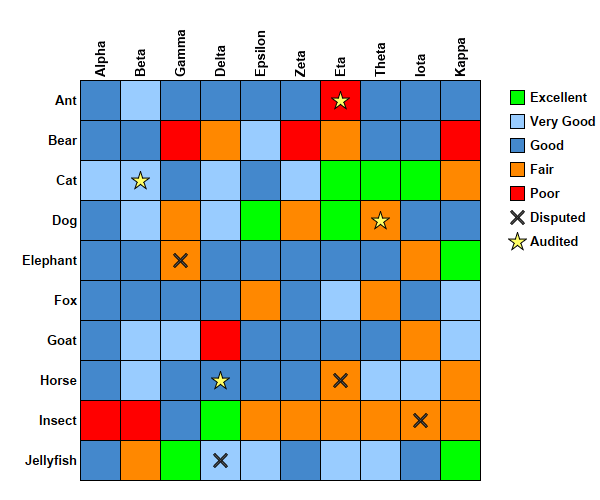
This example demonstrates adding symbols and custom legend keys to the discrete heat map.
The following is the command line version of the code in "cppdemo/heatmapcellsymbols". The MFC version of the code is in "mfcdemo/mfcdemo". The Qt Widgets version of the code is in "qtdemo/qtdemo". The QML/Qt Quick version of the code is in "qmldemo/qmldemo".
#include "chartdir.h"

int main(int argc, char *argv[])
{
    // The x-axis and y-axis labels
    const char* xLabels[] = {"Alpha", "Beta", "Gamma", "Delta", "Epsilon", "Zeta", "Eta", "Theta",
        "Iota", "Kappa"};
    const int xLabels_size = (int)(sizeof(xLabels)/sizeof(*xLabels));
    const char* yLabels[] = {"Ant", "Bear", "Cat", "Dog", "Elephant", "Fox", "Goat", "Horse",
        "Insect", "Jellyfish"};
    const int yLabels_size = (int)(sizeof(yLabels)/sizeof(*yLabels));

    // Random data for the 10 x 10 cells
    RanSeries* rand = new RanSeries(2);
    DoubleArray zData = rand->getSeries(xLabels_size * yLabels_size, 0, 10);

    // The coordinates for the first set of scatter symbols
    double symbolX[] = {2.5, 6.5, 3.5, 8.5};
    const int symbolX_size = (int)(sizeof(symbolX)/sizeof(*symbolX));
    double symbolY[] = {4.5, 7.5, 9.5, 8.5};
    const int symbolY_size = (int)(sizeof(symbolY)/sizeof(*symbolY));

    // The coordinates for the second set of scatter symbols
    double symbol2X[] = {6.5, 3.5, 7.5, 1.5};
    const int symbol2X_size = (int)(sizeof(symbol2X)/sizeof(*symbol2X));
    double symbol2Y[] = {0.5, 7.5, 3.5, 2.5};
    const int symbol2Y_size = (int)(sizeof(symbol2Y)/sizeof(*symbol2Y));

    // Create an XYChart object of size 600 x 500 pixels.
    XYChart* c = new XYChart(600, 500);

    // Set the plotarea at (80, 80) and of size 400 x 400 pixels. Set the background, border, and
    // grid lines to transparent.
    PlotArea* p = c->setPlotArea(80, 80, 400, 400, -1, -1, Chart::Transparent, Chart::Transparent);

    // Add the first set of scatter symbols. Use grey (0x555555) cross shape symbols.
    c->addScatterLayer(DoubleArray(symbolX, symbolX_size), DoubleArray(symbolY, symbolY_size),
        "Disputed", Chart::Cross2Shape(0.2), 15, 0x555555);

    // Add the first set of scatter symbols. Use yellow (0xffff66) star shape symbols.
    c->addScatterLayer(DoubleArray(symbol2X, symbol2X_size), DoubleArray(symbol2Y, symbol2Y_size),
        "Audited", Chart::StarShape(5), 19, 0xffff66);

    // Create a discrete heat map with 10 x 10 cells
    DiscreteHeatMapLayer* layer = c->addDiscreteHeatMapLayer(zData, xLabels_size);

    // Set the x-axis labels. Use 10pt Arial Bold font rotated by 90 degrees. Set axis stem to
    // transparent, so only the labels are visible. Set 0.5 offset to position the labels in between
    // the grid lines. Position the x-axis at the top of the chart.
    c->xAxis()->setLabels(StringArray(xLabels, xLabels_size));
    c->xAxis()->setLabelStyle("Arial Bold", 10, Chart::TextColor, 90);
    c->xAxis()->setColors(Chart::Transparent, Chart::TextColor);
    c->xAxis()->setLabelOffset(0.5);
    c->setXAxisOnTop();

    // Set the y-axis labels. Use 10pt Arial Bold font. Set axis stem to transparent, so only the
    // labels are visible. Set 0.5 offset to position the labels in between the grid lines. Reverse
    // the y-axis so that the labels are flowing top-down instead of bottom-up.
    c->yAxis()->setLabels(StringArray(yLabels, yLabels_size));
    c->yAxis()->setLabelStyle("Arial Bold", 10);
    c->yAxis()->setColors(Chart::Transparent, Chart::TextColor);
    c->yAxis()->setLabelOffset(0.5);
    c->yAxis()->setReverse();

    // Set the color stops and scale
    double colorScale[] = {0, 0xff0000, 1, 0xff8800, 3, 0x4488cc, 7, 0x99ccff, 9, 0x00ff00, 10};
    const int colorScale_size = (int)(sizeof(colorScale)/sizeof(*colorScale));
    const char* colorLabels[] = {"Poor", "Fair", "Good", "Very Good", "Excellent"};
    const int colorLabels_size = (int)(sizeof(colorLabels)/sizeof(*colorLabels));
    layer->colorAxis()->setColorScale(DoubleArray(colorScale, colorScale_size));

    // Position the legend box 20 pixels to the right of the plot area. Use 10pt Arial Bold font.
    // Set the key icon size to 15 x 15 pixels. Set vertical key spacing to 8 pixels.
    LegendBox* b = c->addLegend(p->getRightX() + 20, p->getTopY(), true, "Arial Bold", 10);
    b->setBackground(Chart::Transparent, Chart::Transparent);
    b->setKeySize(15, 15);
    b->setKeySpacing(0, 8);

    // Add the color scale label to the legend box
    for(int i = colorLabels_size - 1; i >= 0; --i) {
        b->addKey(colorLabels[i], (int)(colorScale[i * 2 + 1]));
    }

    // Output the chart
    c->makeChart("heatmapcellsymbols.png");

    //free up resources
    delete rand;
    delete c;

    return 0;
}
© 2023 Advanced Software Engineering Limited. All rights reserved.