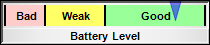
This example demonstrates a linear meter labelled with zones.
The meter in this example is achieved by using
LinearMeter.addZone to add labelled zones. The black lines separating the zones are added by using
BaseMeter.addLabel with empty spaces as labels.
The following is the command line version of the code in "cppdemo/linearzonemeter". The MFC version of the code is in "mfcdemo/mfcdemo". The Qt Widgets version of the code is in "qtdemo/qtdemo". The QML/Qt Quick version of the code is in "qmldemo/qmldemo".
#include "chartdir.h"

int main(int argc, char *argv[])
{
    // The value to display on the meter
    double value = 85;

    // Create an LinearMeter object of size 210 x 45 pixels, using silver background with a 2 pixel
    // black 3D depressed border.
    LinearMeter* m = new LinearMeter(210, 45, Chart::silverColor(), 0, -2);

    // Set the scale region top-left corner at (5, 5), with size of 200 x 20 pixels. The scale
    // labels are located on the bottom (implies horizontal meter)
    m->setMeter(5, 5, 200, 20, Chart::Bottom);

    // Set meter scale from 0 - 100
    m->setScale(0, 100);

    // Add a title at the bottom of the meter with a 1 pixel raised 3D border
    m->addTitle(Chart::Bottom, "Battery Level", "Arial Bold", 8)->setBackground(Chart::Transparent,
        -1, 1);

    // Set 3 zones of different colors to represent Good/Weak/Bad data ranges
    m->addZone(50, 100, 0x99ff99, "Good");
    m->addZone(20, 50, 0xffff66, "Weak");
    m->addZone(0, 20, 0xffcccc, "Bad");

    // Add empty labels (just need the ticks) at 0/20/50/80 as separators for zones
    m->addLabel(0, " ");
    m->addLabel(20, " ");
    m->addLabel(50, " ");
    m->addLabel(100, " ");

    // Add a semi-transparent blue (800000ff) pointer at the specified value, using triangular
    // pointer shape
    m->addPointer(value, 0x800000ff)->setShape(Chart::TriangularPointer);

    // Output the chart
    m->makeChart("linearzonemeter.png");

    //free up resources
    delete m;

    return 0;
}
© 2023 Advanced Software Engineering Limited. All rights reserved.