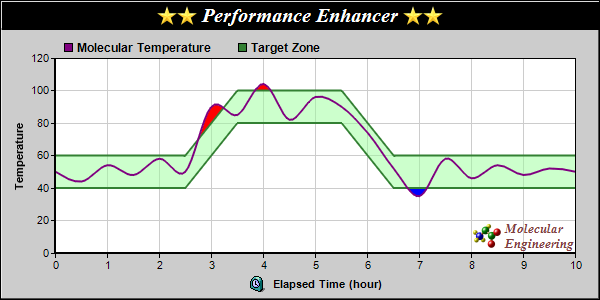
This example demonstrates filling the area between two lines or curves, as well as a number of advanced chart formatting techniques.
ChartDirector supports filling the area between two lines. The lines can be from a
LineLayer,
SplineLayer,
StepLineLayer,
TrendLayer or from an axis
Mark. Two colors can be used for filling, depending on which line is on top.
The effects in this example is achieved using the following methods:
The following is the command line version of the code in "cppdemo/linecompare". The MFC version of the code is in "mfcdemo/mfcdemo". The Qt Widgets version of the code is in "qtdemo/qtdemo". The QML/Qt Quick version of the code is in "qmldemo/qmldemo".
#include "chartdir.h"

int main(int argc, char *argv[])
{
    // The data for the upper and lower bounding lines
    double upperY[] = {60, 60, 100, 100, 60, 60};
    const int upperY_size = (int)(sizeof(upperY)/sizeof(*upperY));
    double lowerY[] = {40, 40, 80, 80, 40, 40};
    const int lowerY_size = (int)(sizeof(lowerY)/sizeof(*lowerY));
    double zoneX[] = {0, 2.5, 3.5, 5.5, 6.5, 10};
    const int zoneX_size = (int)(sizeof(zoneX)/sizeof(*zoneX));

    // The data for the spline curve
    double curveY[] = {50, 44, 54, 48, 58, 50, 90, 85, 104, 82, 96, 90, 74, 52, 35, 58, 46, 54, 48,
        52, 50};
    const int curveY_size = (int)(sizeof(curveY)/sizeof(*curveY));
    double curveX[] = {0, 0.5, 1, 1.5, 2, 2.5, 3, 3.5, 4, 4.5, 5, 5.5, 6, 6.5, 7, 7.5, 8, 8.5, 9,
        9.5, 10};
    const int curveX_size = (int)(sizeof(curveX)/sizeof(*curveX));

    // Create a XYChart object of size 600 x 300 pixels, with a light grey (cccccc) background,
    // black border, and 1 pixel 3D border effect.
    XYChart* c = new XYChart(600, 300, 0xcccccc, 0x000000, 1);

    // Set the plotarea at (55, 58) and of size 520 x 195 pixels, with white background. Turn on
    // both horizontal and vertical grid lines with light grey color (cccccc)
    c->setPlotArea(55, 58, 520, 195, 0xffffff, -1, -1, 0xcccccc, 0xcccccc);

    // Add a legend box at (55, 32) (top of the chart) with horizontal layout. Use 9pt Arial Bold
    // font. Set the background and border color to Transparent.
    c->addLegend(55, 32, false, "Arial Bold", 9)->setBackground(Chart::Transparent);

    // Add a title box to the chart using 15pt Times Bold Italic font. The title is in CDML and
    // includes embedded images for highlight. The text is white (ffffff) on a black background,
    // with a 1 pixel 3D border.
    c->addTitle(
        "<*block,valign=absmiddle*><*img=star.png*><*img=star.png*> Performance Enhancer "
        "<*img=star.png*><*img=star.png*><*/*>", "Times New Roman Bold Italic", 15, 0xffffff
        )->setBackground(0x000000, -1, 1);

    // Add a title to the y axis
    c->yAxis()->setTitle("Temperature");

    // Add a title to the x axis using CMDL
    c->xAxis()->setTitle("<*block,valign=absmiddle*><*img=clock.png*>  Elapsed Time (hour)<*/*>");

    // Set the axes width to 2 pixels
    c->xAxis()->setWidth(2);
    c->yAxis()->setWidth(2);

    // Add a purple (800080) spline layer to the chart with a line width of 2 pixels
    SplineLayer* splineLayer = c->addSplineLayer(DoubleArray(curveY, curveY_size), 0x800080,
        "Molecular Temperature");
    splineLayer->setXData(DoubleArray(curveX, curveX_size));
    splineLayer->setLineWidth(2);

    // Add a line layer to the chart with two dark green (338033) data sets, and a line width of 2
    // pixels
    LineLayer* lineLayer = c->addLineLayer();
    lineLayer->addDataSet(DoubleArray(upperY, upperY_size), 0x338033, "Target Zone");
    lineLayer->addDataSet(DoubleArray(lowerY, lowerY_size), 0x338033);
    lineLayer->setXData(DoubleArray(zoneX, zoneX_size));
    lineLayer->setLineWidth(2);

    // Color the zone between the upper zone line and lower zone line as semi-transparent light
    // green (8099ff99)
    c->addInterLineLayer(lineLayer->getLine(0), lineLayer->getLine(1), 0x8099ff99, 0x8099ff99);

    // If the spline line gets above the upper zone line, color to area between the lines red
    // (ff0000)
    c->addInterLineLayer(splineLayer->getLine(0), lineLayer->getLine(0), 0xff0000,
        Chart::Transparent);

    // If the spline line gets below the lower zone line, color to area between the lines blue
    // (0000ff)
    c->addInterLineLayer(splineLayer->getLine(0), lineLayer->getLine(1), Chart::Transparent,
        0x0000ff);

    // Add a custom CDML text at the bottom right of the plot area as the logo
    c->addText(575, 250,
        "<*block,valign=absmiddle*><*img=small_molecule.png*> <*block*><*font=Times New Roman Bold "
        "Italic,size=10,color=804040*>Molecular\nEngineering<*/*>")->setAlignment(Chart::BottomRight
        );

    // Output the chart
    c->makeChart("linecompare.png");

    //free up resources
    delete c;

    return 0;
}
© 2023 Advanced Software Engineering Limited. All rights reserved.