This example demonstrates filling the area between two lines or curves.
In ChartDirector, an
InterLineLayer can be used to fill the region between any two lines. The lines can be from a
LineLayer,
StepLineLayer,
SplineLayer,
TrendLayer, or from an axis
Mark. Two colors can be used for filling, depending on which line is on top.
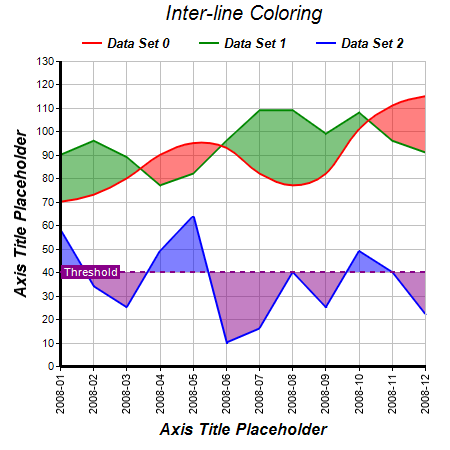
In this example, an InterLineLayer is used to fill the region between a normal line and a spline curve. Another InterLineLayer is used to fill the region between a normal line and a mark line. The fill color differs depending on which line is on top.
The following is the command line version of the code in "cppdemo/linefill". The MFC version of the code is in "mfcdemo/mfcdemo". The Qt Widgets version of the code is in "qtdemo/qtdemo". The QML/Qt Quick version of the code is in "qmldemo/qmldemo".
#include "chartdir.h"

int main(int argc, char *argv[])
{
    // The data for the line chart
    double data0[] = {70, 73, 80, 90, 95, 93, 82, 77, 82, 101, 111, 115};
    const int data0_size = (int)(sizeof(data0)/sizeof(*data0));
    double data1[] = {90, 96, 89, 77, 82, 96, 109, 109, 99, 108, 96, 91};
    const int data1_size = (int)(sizeof(data1)/sizeof(*data1));
    double data2[] = {58, 34, 25, 49, 64, 10, 16, 40, 25, 49, 40, 22};
    const int data2_size = (int)(sizeof(data2)/sizeof(*data2));

    // The labels for the line chart
    const char* labels[] = {"2008-01", "2008-02", "2008-03", "2008-04", "2008-05", "2008-06",
        "2008-07", "2008-08", "2008-09", "2008-10", "2008-11", "2008-12"};
    const int labels_size = (int)(sizeof(labels)/sizeof(*labels));

    // Create a XYChart object of size 450 x 450 pixels
    XYChart* c = new XYChart(450, 450);

    // Add a title to the chart using 15pt Arial Italic font.
    TextBox* title = c->addTitle("Inter-line Coloring", "Arial Italic", 15);

    // Add a legend box where the top-center is anchored to the horizontal center of the chart, just
    // under the title. Use horizontal layout and 10 points Arial Bold font, and transparent
    // background and border. Use line style legend key.
    LegendBox* legendBox = c->addLegend(c->getWidth() / 2, title->getHeight(), false,
        "Arial Bold Italic", 10);
    legendBox->setBackground(Chart::Transparent, Chart::Transparent);
    legendBox->setAlignment(Chart::TopCenter);
    legendBox->setLineStyleKey();

    // Tentatively set the plotarea at (70, 65) and of (chart_width - 100) x (chart_height - 110) in
    // size. Use light grey (c0c0c0) border and horizontal and vertical grid lines.
    PlotArea* plotArea = c->setPlotArea(70, 65, c->getWidth() - 100, c->getHeight() - 110, -1, -1,
        0xc0c0c0, 0xc0c0c0, -1);

    // Add a title to the y axis using 12pt Arial Bold Italic font
    c->yAxis()->setTitle("Axis Title Placeholder", "Arial Bold Italic", 12);

    // Add a title to the x axis using 12pt Arial Bold Italic font
    c->xAxis()->setTitle("Axis Title Placeholder", "Arial Bold Italic", 12);

    // Set the axes line width to 3 pixels
    c->xAxis()->setWidth(3);
    c->yAxis()->setWidth(3);

    // Set the labels on the x axis.
    c->xAxis()->setLabels(StringArray(labels, labels_size));

    // Use 8 points Arial rotated by 90 degrees as the x-axis label font
    c->xAxis()->setLabelStyle("Arial", 8, Chart::TextColor, 90);

    // Add a spline curve to the chart
    SplineLayer* layer0 = c->addSplineLayer(DoubleArray(data0, data0_size), 0xff0000, "Data Set 0");
    layer0->setLineWidth(2);

    // Add a normal line to the chart
    LineLayer* layer1 = c->addLineLayer(DoubleArray(data1, data1_size), 0x008800, "Data Set 1");
    layer1->setLineWidth(2);

    // Color the region between the above spline curve and normal line. Use the semi-transparent red
    // (80ff000000) if the spline curve is higher than the normal line, otherwise use
    // semi-transparent green (80008800)
    c->addInterLineLayer(layer0->getLine(), layer1->getLine(), 0x80ff0000, 0x80008800);

    // Add another normal line to the chart
    LineLayer* layer2 = c->addLineLayer(DoubleArray(data2, data2_size), 0x0000ff, "Data Set 2");
    layer2->setLineWidth(2);

    // Add a horizontal mark line to the chart at y = 40
    Mark* mark = c->yAxis()->addMark(40, -1, "Threshold");
    mark->setLineWidth(2);

    // Set the mark line to purple (880088) dash line. Use white (ffffff) for the mark label.
    mark->setMarkColor(c->dashLineColor(0x880088), 0xffffff);

    // Put the mark label at the left side of the mark, with a purple (880088) background.
    mark->setAlignment(Chart::Left);
    mark->setBackground(0x880088);

    // Color the region between the above normal line and mark line. Use the semi-transparent blue
    // (800000ff) if the normal line is higher than the mark line, otherwise use semi-transparent
    // purple (80880088)
    c->addInterLineLayer(layer2->getLine(), mark->getLine(), 0x800000ff, 0x80880088);

    // Layout the legend box, so we can get its height
    c->layoutLegend();

    // Adjust the plot area size, such that the bounding box (inclusive of axes) is 10 pixels from
    // the left edge, just under the legend box, 25 pixels from the right edge, and 10 pixels from
    // the bottom edge.
    c->packPlotArea(10, legendBox->getTopY() + legendBox->getHeight(), c->getWidth() - 25,
        c->getHeight() - 10);

    // After determining the exact plot area position, we may adjust the legend box and the title
    // positions so that they are centered relative to the plot area (instead of the chart)
    legendBox->setPos(plotArea->getLeftX() + (plotArea->getWidth() - legendBox->getWidth()) / 2,
        legendBox->getTopY());
    title->setPos(plotArea->getLeftX() + (plotArea->getWidth() - title->getWidth()) / 2,
        title->getTopY());

    // Output the chart
    c->makeChart("linefill.png");

    //free up resources
    delete c;

    return 0;
}
© 2023 Advanced Software Engineering Limited. All rights reserved.