[MFC version] mfcdemo/MegaRealTimeZoomScrollDlg.cpp
// CMegaRealTimeZoomScrollDlg.cpp : implementation file
//
#include "stdafx.h"
#include "resource.h"
#include "MegaRealTimeZoomScrollDlg.h"
#include <vector>
#include <string>
#include <sstream>
#include <algorithm>
#ifdef _DEBUG
#define new DEBUG_NEW
#endif
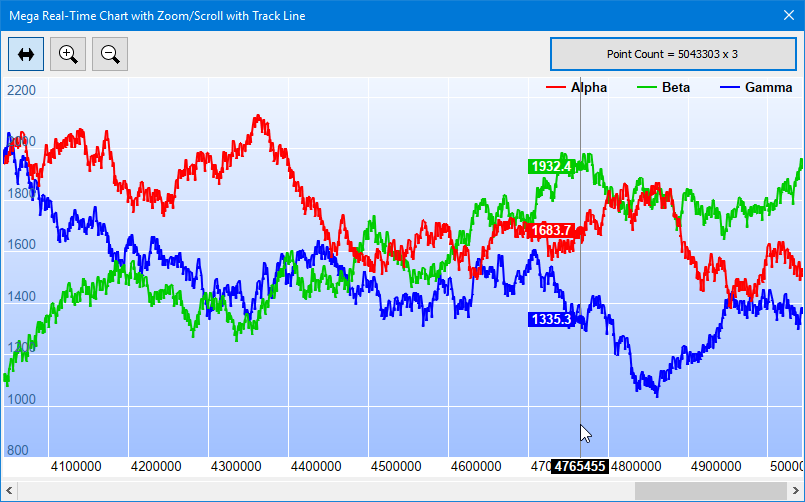
// In this example, we plot 3 real-time series, each with 10,000,000 points maximum.
// For demonstration purpose, we will pre-load half of the buffer with random data.
// The remaining half wlll be filled with real-time random data at a rate of 1000
// points per series per second.
static int bufferSize = 10000000;
// Timer to update the chart every 100ms
static const int ChartUpdateTimer = 1;
static const int ChartUpdateInterval = 100;
// The full x-axis range is at least 60 seconds (60000ms), and the maximum zooming
// is 10ms visible x-axis range.
static const double minXRange = 60000;
static const double zoomInLimit = 10;
//
// Constructor
//
CMegaRealTimeZoomScrollDlg::CMegaRealTimeZoomScrollDlg(CWnd* pParent /*=nullptr*/)
: CDialog(IDD_MEGAREALTIMEZOOMSCROLL, pParent), m_realTimeData(999)
{
m_currentIndex = 0;
m_fastData = 0;
m_hasFinishedInitialization = false;
m_lastUpdateTime = clock();
}
//
// Destructor
//
CMegaRealTimeZoomScrollDlg::~CMegaRealTimeZoomScrollDlg()
{
delete m_ChartViewer.getChart();
delete m_fastData;
}
void CMegaRealTimeZoomScrollDlg::DoDataExchange(CDataExchange* pDX)
{
CDialog::DoDataExchange(pDX);
DDX_Control(pDX, IDC_ChartViewer, m_ChartViewer);
DDX_Control(pDX, IDC_HScrollBar, m_HScrollBar);
DDX_Control(pDX, IDC_PointerPB, m_PointerPB);
DDX_Control(pDX, IDC_PlotChartPB, m_PlotChartPB);
}
BEGIN_MESSAGE_MAP(CMegaRealTimeZoomScrollDlg, CDialog)
ON_WM_TIMER()
ON_BN_CLICKED(IDC_PointerPB, OnPointerPB)
ON_BN_CLICKED(IDC_ZoomInPB, OnZoomInPB)
ON_BN_CLICKED(IDC_ZoomOutPB, OnZoomOutPB)
ON_WM_HSCROLL()
ON_CONTROL(CVN_ViewPortChanged, IDC_ChartViewer, OnViewPortChanged)
ON_CONTROL(CVN_MouseMovePlotArea, IDC_ChartViewer, OnMouseMovePlotArea)
ON_BN_CLICKED(IDC_PlotChartPB, OnClickPlotChart)
END_MESSAGE_MAP()
//
// Initialization
//
BOOL CMegaRealTimeZoomScrollDlg::OnInitDialog()
{
CDialog::OnInitDialog();
// Load icons to mouse usage buttons
loadButtonIcon(IDC_PointerPB, IDI_Scroll, 20, 20);
loadButtonIcon(IDC_ZoomInPB, IDI_ZoomIn, 20, 20);
loadButtonIcon(IDC_ZoomOutPB, IDI_ZoomOut, 20, 20);
// The data buffer
m_dataSeriesA.resize(bufferSize);
m_dataSeriesB.resize(bufferSize);
m_dataSeriesC.resize(bufferSize);
m_timeStamps.resize(bufferSize);
// Pre-load half of the buffer with random data
loadData();
// Display initial Message
PieChart* c = new PieChart(800, 400, 0xd0e0ff);
c->addTitle(Chart::Center, "<*block,halign=left,maxwidth=500*>"
"<*font=Arial Bold,size=18,underline=2*>Mega Real-Time Chart<*/font*><*br*><*br*>"
"This example demonstrates a real time chart with huge amount of data. It contains "
"3 lines pre-loaded with 5 million points each, then 1000 points are added to each "
"line per second. We limit it to 3 x 10 million points so that it needs less than "
"1G of RAM (320M to store the data, 600M to plot the data and handle the GUI)."
"<*br*><*br*><*br*>Press the Plot Chart button to plot the chart.");
m_ChartViewer.setChart(c);
return TRUE;
}
//
// User clicks on the Pointer pushbutton
//
void CMegaRealTimeZoomScrollDlg::OnPointerPB()
{
m_ChartViewer.setMouseUsage(Chart::MouseUsageScroll);
}
//
// User clicks on the Zoom In pushbutton
//
void CMegaRealTimeZoomScrollDlg::OnZoomInPB()
{
m_ChartViewer.setMouseUsage(Chart::MouseUsageZoomIn);
}
//
// User clicks on the Zoom Out pushbutton
//
void CMegaRealTimeZoomScrollDlg::OnZoomOutPB()
{
m_ChartViewer.setMouseUsage(Chart::MouseUsageZoomOut);
}
//anonymouse namespace to avoid naming conflicts
namespace
{
//
// ThreadTask - A utility to run code in separate threads.
//
// Usage:
// - Derived from ThreadTask, and override the "virtual void run()" method. Put the
// code you want to run in this method.
//
// - Create your derived object, and call the "start()" method. The object will then
// execute the run() method in another thread. The "start()" method will return
// immediately without blocking. In this way, you can create multiple objects to
// run code in separate threads.
//
// - You can call the "wait()" method if you want to wait until the code in "run()"
// has been completed.
//
class ThreadTask
{
private:
//disable copying
ThreadTask(const ThreadTask& rhs);
ThreadTask& operator=(const ThreadTask& rhs);
HANDLE doneEvent;
static DWORD WINAPI threadHandler(_In_ LPVOID lpParameter)
{
ThreadTask* self = (ThreadTask*)lpParameter;
self->run();
SetEvent(self->doneEvent);
return 0;
}
public:
ThreadTask() : doneEvent(0)
{
}
virtual ~ThreadTask()
{
if (doneEvent)
CloseHandle(doneEvent);
}
void start()
{
doneEvent = CreateEventA(NULL, FALSE, FALSE, NULL);
QueueUserWorkItem(threadHandler, this, 0);
}
DWORD wait(DWORD timeout = INFINITE)
{
return doneEvent ? WaitForSingleObject(doneEvent, timeout) : WAIT_FAILED;
}
virtual void run() = 0;
};
// A thread task used for random number generator. Because of the large number of data
// points, we will create 3 random number generators running in 3 threads to speed up
// random number generation.
class RanSeriesTask : public ThreadTask
{
private:
int seed; // random number seed
double* buffer; // buffer to store the result
int count; // the count of random numbers
public:
RanSeriesTask(int seed, double* buffer, int count)
: seed(seed), buffer(buffer), count(count)
{
start(); // auto start the thread after object creation
}
virtual void run()
{
// Generate random numbers
RanSeries r(seed);
r.fillSeries(buffer, count, 2500, -1, 1);
}
};
// A thread task used for processing the data series in the data accelerator. We will
// create 3 threads so that 3 data series can be processed concurrently.
class FastSeriesTask : public ThreadTask
{
private:
DataAccelerator* fastDB;
const char* id;
const double* data;
int len;
public:
FastSeriesTask(DataAccelerator* fastDB, const char* id, const double* data, int len)
: fastDB(fastDB), id(id), data(data), len(len)
{
start(); // auto start the thread after object creation
}
virtual void run()
{
// Process the data series
fastDB->addDataSeries(id, data, len);
}
};
}
//
// Pre-load half of the buffer with random data
//
void CMegaRealTimeZoomScrollDlg::loadData()
{
int initialSize = bufferSize / 2;
RanSeriesTask taskA(109, &m_dataSeriesA[0], initialSize);
RanSeriesTask taskB(110, &m_dataSeriesB[0], initialSize);
RanSeriesTask taskC(111, &m_dataSeriesC[0], initialSize);
for (int i = 0; i < initialSize; ++i)
m_timeStamps[i] = i;
taskA.wait();
taskB.wait();
taskC.wait();
m_currentIndex = initialSize;
}
//
// User clicks on the Plot Chart pushbutton
//
void CMegaRealTimeZoomScrollDlg::OnClickPlotChart()
{
// Has already initialized ??
if (m_hasFinishedInitialization)
return;
// This example uses a DataAccelerator to speed up the large amount of data. As we
// pre-load half of the buffer with random data, we need to process them first.
// To speed up, we create two threads to process two of the data series, and use the
// current thread to process the third series.
m_fastData = new DataAccelerator(&m_timeStamps[0], m_currentIndex);
FastSeriesTask task1(m_fastData, "mA", &m_dataSeriesA[0], m_currentIndex);
FastSeriesTask task2(m_fastData, "mB", &m_dataSeriesB[0], m_currentIndex);
m_fastData->addDataSeries("mC", &m_dataSeriesC[0], m_currentIndex);
task1.wait();
task2.wait();
// Initialize the CChartViewer
initChartViewer(&m_ChartViewer);
m_hasFinishedInitialization = true;
SetTimer(ChartUpdateTimer, ChartUpdateInterval, 0);
// Trigger the ViewPortChanged event to draw the chart
m_ChartViewer.updateViewPort(true, true);
}
//
// Initialize the CChartViewer
//
void CMegaRealTimeZoomScrollDlg::initChartViewer(CChartViewer* viewer)
{
if (m_currentIndex > 0)
{
// Set the full x range to be the data range, or at least minXRange.
double duration = (std::max)(m_timeStamps[m_currentIndex - 1] - m_timeStamps[0], minXRange);
viewer->setFullRange("x", m_timeStamps[0], m_timeStamps[0] + duration);
// Initialize the view port to show the latest 20% of the x range, or at least minXRange.
viewer->setViewPortWidth((std::max)(0.2, minXRange / duration));
viewer->setViewPortLeft(1 - viewer->getViewPortWidth());
// Set the maximum zoom to 10 x-units
viewer->setZoomInWidthLimit((std::min)(1.0, zoomInLimit / duration));
}
// Enable mouse wheel zooming by setting the zoom ratio to 1.1 per wheel event
viewer->setMouseWheelZoomRatio(1.1);
// Initially set the mouse to drag to scroll mode.
m_PointerPB.SetCheck(1);
viewer->setMouseUsage(Chart::MouseUsageScroll);
}
//
// The ViewPortChanged event handler. This event occurs if the user scrolls or zooms in or
// out the chart by dragging or clicking on the chart. It can also be triggered by calling
// CChartViewer.updateViewPort.
//
void CMegaRealTimeZoomScrollDlg::OnViewPortChanged()
{
if (!m_hasFinishedInitialization)
return;
// In addition to updating the chart, we may also need to update other controls that
// changes based on the view port.
updateControls(&m_ChartViewer);
// Update the chart if necessary
if (m_ChartViewer.needUpdateChart())
drawChart(&m_ChartViewer);
}
//
// User clicks on the the horizontal scroll bar
//
void CMegaRealTimeZoomScrollDlg::OnHScroll(UINT nSBCode, UINT nPos, CScrollBar* pScrollBar)
{
double newViewPortLeft = moveScrollBar(nSBCode, nPos, pScrollBar);
// Update the view port if the scroll bar has really moved
if (m_hasFinishedInitialization && (newViewPortLeft != m_ChartViewer.getViewPortLeft()))
{
m_ChartViewer.setViewPortLeft(newViewPortLeft);
m_ChartViewer.updateViewPort(true, false);
}
}
//
// Draw track cursor when mouse is moving over plotarea
//
void CMegaRealTimeZoomScrollDlg::OnMouseMovePlotArea()
{
if (!m_hasFinishedInitialization)
return;
trackLineLabel((XYChart*)m_ChartViewer.getChart(), m_ChartViewer.getPlotAreaMouseX());
m_ChartViewer.updateDisplay();
}
//
// Handles timer events
//
void CMegaRealTimeZoomScrollDlg::OnTimer(UINT_PTR nIDEvent)
{
switch (nIDEvent)
{
case ChartUpdateTimer:
// Is chart update timer
OnChartUpdateTimer();
break;
}
CDialog::OnTimer(nIDEvent);
}
//
// Handles chart update timer
//
void CMegaRealTimeZoomScrollDlg::OnChartUpdateTimer()
{
// Append real time data to the data arrays
if (getRealTimeData())
{
// Notify the DataAccelerator that new data are appended to the arrays, so it
// can accelerate them.
m_fastData->extendLength(m_currentIndex);
// We need to update the full x range to include the new data
updateAxisScale(&m_ChartViewer);
}
}
//
// Obtain real time data
//
bool CMegaRealTimeZoomScrollDlg::getRealTimeData()
{
// In this example, we simulate a data source that can produced 3 x 1000 data points
// per second and store the data in a buffer. When the chart is updated, it will
// retrieve the data in the buffer.
// In this example, we determine the time elapsed since last chart update and assume
// there are already the requirement amount of data points in the buffer.
clock_t currentTime = clock();
if (currentTime < m_lastUpdateTime)
m_lastUpdateTime = currentTime;
int pointCount = (int)((currentTime - m_lastUpdateTime) * 1000.0 / CLOCKS_PER_SEC);
pointCount = (std::min)(pointCount, bufferSize - m_currentIndex);
m_lastUpdateTime += CLOCKS_PER_SEC * pointCount / 1000;
// We append the data to the arrays
for (int i = m_currentIndex; i < m_currentIndex + pointCount; ++i)
m_timeStamps[i] = i;
// The data values are obtained from our random number generator. The following code
// ensures the random data series form a continuous line.
if (m_currentIndex == 0)
{
// If the data arrays are empty, just generate some random data series.
m_realTimeData.fillSeries(&m_dataSeriesA[m_currentIndex], pointCount, 2500, -1, 1);
m_realTimeData.fillSeries(&m_dataSeriesB[m_currentIndex], pointCount, 2500, -1, 1);
m_realTimeData.fillSeries(&m_dataSeriesC[m_currentIndex], pointCount, 2500, -1, 1);
}
else
{
// If the data arrays are not empty, when append random data, ensure it starts from
// the last data point to make a continuous series.
--m_currentIndex;
++pointCount;
m_realTimeData.fillSeries(&m_dataSeriesA[m_currentIndex], pointCount,
m_dataSeriesA[m_currentIndex], -1, 1);
m_realTimeData.fillSeries(&m_dataSeriesB[m_currentIndex], pointCount,
m_dataSeriesB[m_currentIndex], -1, 1);
m_realTimeData.fillSeries(&m_dataSeriesC[m_currentIndex], pointCount,
m_dataSeriesC[m_currentIndex], -1, 1);
}
m_currentIndex += pointCount;
// Displaying the point count in the pushbutton control to provide some feedback
char buffer[1024];
sprintf_s(buffer, sizeof(buffer), "Point Count = %d x 3", m_currentIndex);
m_PlotChartPB.SetWindowText(UTF8toTCHAR(buffer));
// Return true if new data are available
return pointCount > 0;
}
//
// As we added more data, we may need to update the full range.
//
void CMegaRealTimeZoomScrollDlg::updateAxisScale(CChartViewer* viewer)
{
double startTime = m_timeStamps[0];
double endTime = m_timeStamps[m_currentIndex - 1];
// Use x-axis range must be at least equal the minXRange.
double duration = endTime - startTime;
if (duration < minXRange)
endTime = startTime + minXRange;
// Update the full range to reflect the actual duration of the data. In this case,
// if the view port is viewing the latest data, we will scroll the view port as new
// data are added. If the view port is viewing historical data, we would keep the
// axis scale unchanged to keep the chart stable.
int updateType = (viewer->getViewPortRight() < 0.999) ? Chart::KeepVisibleRange :
Chart::ScrollWithMax;
bool axisScaleHasChanged = viewer->updateFullRangeH("x", startTime, endTime,
updateType);
// Set the zoom in limit as a ratio to the full range
viewer->setZoomInWidthLimit((std::min)(1.0, zoomInLimit / (viewer->getValueAtViewPort("x", 1)
- viewer->getValueAtViewPort("x", 0))));
// Trigger the viewPortChanged event to update the display if the axis scale has
// changed or if new data are added to the existing axis scale.
if (axisScaleHasChanged || (duration < minXRange))
viewer->updateViewPort(true, false);
}
//
// Update other controls that may be affected by the viewport.
//
void CMegaRealTimeZoomScrollDlg::updateControls(CChartViewer* viewer)
{
// In this demo, we need to update the scroll bar to reflect the view port position and
// width of the view port.
m_HScrollBar.EnableWindow(viewer->getViewPortWidth() < 1);
if (viewer->getViewPortWidth() < 1)
{
SCROLLINFO info;
info.cbSize = sizeof(SCROLLINFO);
info.fMask = SIF_ALL;
info.nMin = 0;
info.nMax = 0x1fffffff;
info.nPage = (int)ceil(viewer->getViewPortWidth() * (info.nMax - info.nMin));
info.nPos = (int)(0.5 + viewer->getViewPortLeft() * (info.nMax - info.nMin)) + info.nMin;
m_HScrollBar.SetScrollInfo(&info);
}
}
//
// Handle scroll bar events
//
double CMegaRealTimeZoomScrollDlg::moveScrollBar(UINT nSBCode, UINT nPos, CScrollBar* pScrollBar)
{
//
// Get current scroll bar position
//
SCROLLINFO info;
info.cbSize = sizeof(SCROLLINFO);
info.fMask = SIF_ALL;
pScrollBar->GetScrollInfo(&info);
//
// Compute new position based on the type of scroll bar events
//
int newPos = info.nPos;
switch (nSBCode)
{
case SB_LEFT:
newPos = info.nMin;
break;
case SB_RIGHT:
newPos = info.nMax;
break;
case SB_LINELEFT:
newPos -= (info.nPage > 10) ? info.nPage / 10 : 1;
break;
case SB_LINERIGHT:
newPos += (info.nPage > 10) ? info.nPage / 10 : 1;
break;
case SB_PAGELEFT:
newPos -= info.nPage;
break;
case SB_PAGERIGHT:
newPos += info.nPage;
break;
case SB_THUMBTRACK:
newPos = info.nTrackPos;
break;
}
if (newPos < info.nMin) newPos = info.nMin;
if (newPos > info.nMax) newPos = info.nMax;
// Update the scroll bar with the new position
pScrollBar->SetScrollPos(newPos);
// Returns the position of the scroll bar as a ratio of its total length
return ((double)(newPos - info.nMin)) / (info.nMax - info.nMin);
}
//
// Draw the chart and display it in the given viewer
//
void CMegaRealTimeZoomScrollDlg::drawChart(CChartViewer* viewer)
{
// Get the start date and end date that are visible on the chart.
double viewPortStartDate = viewer->getValueAtViewPort("x", viewer->getViewPortLeft());
double viewPortEndDate = viewer->getValueAtViewPort("x", viewer->getViewPortRight());
m_fastData->setSubsetRange(viewPortStartDate, viewPortEndDate);
//
// At this stage, we have extracted the visible data. We can use those data to plot the chart.
//
//================================================================================
// Configure overall chart appearance.
//================================================================================
XYChart* c = new XYChart(800, 400);
// Set the plotarea at (0, 0) with width 1 pixel less than chart width, and height 20 pixels
// less than chart height. Use a vertical gradient from light blue (f0f6ff) to sky blue (a0c0ff)
// as background. Set border to transparent and grid lines to white (ffffff).
c->setPlotArea(0, 0, c->getWidth() - 1, c->getHeight() - 20, c->linearGradientColor(0, 0, 0,
c->getHeight() - 20, 0xf0f6ff, 0xa0c0ff), -1, Chart::Transparent, 0xffffff, 0xffffff);
// In our code, we can overdraw the line slightly, so we clip it to the plot area.
c->setClipping();
// Add a legend box at the right side using horizontal layout. Use 10pt Arial Bold as font. Set
// the background and border color to Transparent and use line style legend key.
LegendBox* b = c->addLegend(c->getWidth() - 1, 10, false, "Arial Bold", 10);
b->setBackground(Chart::Transparent);
b->setAlignment(Chart::Right);
b->setLineStyleKey();
// Set the x and y axis stems to transparent and the label font to 10pt Arial
c->xAxis()->setColors(Chart::Transparent);
c->yAxis()->setColors(Chart::Transparent);
c->xAxis()->setLabelStyle("Arial", 10);
c->yAxis()->setLabelStyle("Arial", 10, 0x336699);
// Configure the y-axis label to be inside the plot area and above the horizontal grid lines
c->yAxis()->setLabelGap(-1);
c->yAxis()->setMargin(20);
c->yAxis()->setLabelAlignment(1);
// Configure the x-axis labels to be to the left of the vertical grid lines
c->xAxis()->setLabelAlignment(1);
//================================================================================
// Add data to chart
//================================================================================
// Add line layers using the DataAccelerator. Each layer only supports one accelerated
// series, so we add 3 layers for the 3 data series.
LineLayer* layer = c->addLineLayer(m_fastData, "mA", 0xff0000, "Alpha");
layer->setLineWidth(2);
LineLayer* layer2 = c->addLineLayer(m_fastData, "mB", 0x00cc00, "Beta");
layer2->setLineWidth(2);
LineLayer* layer3 = c->addLineLayer(m_fastData, "mC", 0x0000ff, "Gamma");
layer3->setLineWidth(2);
//================================================================================
// Configure axis scale and labelling
//================================================================================
// Sync the x-axis with the view port if the chart is not empty
if (m_currentIndex > 0)
viewer->syncLinearAxisWithViewPort("x", c->xAxis());
// For the automatic axis labels, set the minimum spacing to 75/40 pixels for the x/y axis.
c->xAxis()->setTickDensity(75);
c->yAxis()->setTickDensity(40);
// Set the auto-scale margin to 0.05, and the zero affinity to 0.2
c->yAxis()->setAutoScale(0.05, 0.05, 0.2);
//================================================================================
// Output the chart
//================================================================================
// We need to update the track line too. If the mouse is moving on the chart (eg. if
// the user drags the mouse on the chart to scroll it), the track line will be updated
// in the MouseMovePlotArea event. Otherwise, we need to update the track line here.
if ((!viewer->isInMouseMoveEvent()) && viewer->isMouseOnPlotArea())
trackLineLabel(c, viewer->getPlotAreaMouseX());
delete viewer->getChart();
viewer->setChart(c);
}
//
// Draw the track line with legend
//
void CMegaRealTimeZoomScrollDlg::trackLineLabel(XYChart* c, int mouseX)
{
// Obtain the dynamic layer of the chart
DrawArea* d = c->initDynamicLayer();
// The plot area object
PlotArea* plotArea = c->getPlotArea();
// Get the data x-value that is nearest to the mouse, and find its pixel coordinate.
double xValue = c->getNearestXValue(mouseX);
int xCoor = c->getXCoor(xValue);
if (xCoor < plotArea->getLeftX())
return;
// Draw a vertical track line at the x-position
d->vline(plotArea->getTopY(), plotArea->getBottomY(), xCoor, 0x888888);
// Draw a label on the x-axis to show the track line position.
std::ostringstream xlabel;
xlabel << "<*font,bgColor=000000*> " << c->formatValue(xValue, "{value}") << " <*/font*>";
TTFText* t = d->text(xlabel.str().c_str(), "Arial Bold", 10);
// Restrict the x-pixel position of the label to make sure it stays inside the chart image.
int xLabelPos = (std::max)(0, (std::min)(xCoor - t->getWidth() / 2, c->getWidth() - t->getWidth()));
t->draw(xLabelPos, plotArea->getBottomY() + 2, 0xffffff);
t->destroy();
// Iterate through all layers to draw the data labels
for (int i = 0; i < c->getLayerCount(); ++i) {
Layer* layer = c->getLayerByZ(i);
// The data array index of the x-value
int xIndex = layer->getXIndexOf(xValue);
// Iterate through all the data sets in the layer
for (int j = 0; j < layer->getDataSetCount(); ++j)
{
DataSet* dataSet = layer->getDataSetByZ(j);
const char* dataSetName = dataSet->getDataName();
// Get the color, name and position of the data label
int color = dataSet->getDataColor();
int yCoor = c->getYCoor(dataSet->getPosition(xIndex), dataSet->getUseYAxis());
// Draw a track dot with a label next to it for visible data points in the plot area
if ((yCoor >= plotArea->getTopY()) && (yCoor <= plotArea->getBottomY()) && (color !=
Chart::Transparent) && dataSetName && *dataSetName)
{
d->circle(xCoor, yCoor, 4, 4, color, color);
std::ostringstream label;
label << "<*font,bgColor=" << std::hex << color << "*> "
<< c->formatValue(dataSet->getValue(xIndex), "{value|P4}") << " <*font*>";
t = d->text(label.str().c_str(), "Arial Bold", 10);
// Draw the label on the right side of the dot if the mouse is on the left side the
// chart, and vice versa. This ensures the label will not go outside the chart image.
if (xCoor <= (plotArea->getLeftX() + plotArea->getRightX()) / 2)
t->draw(xCoor + 6, yCoor, 0xffffff, Chart::Left);
else
t->draw(xCoor - 6, yCoor, 0xffffff, Chart::Right);
t->destroy();
}
}
}
}
/////////////////////////////////////////////////////////////////////////////
// General utilities
//
// Load an icon resource into a button
//
void CMegaRealTimeZoomScrollDlg::loadButtonIcon(int buttonId, int iconId, int width, int height)
{
// Resize the icon to match the screen DPI for high DPI support
HDC screen = ::GetDC(0);
double scaleFactor = GetDeviceCaps(screen, LOGPIXELSX) / 96.0;
::ReleaseDC(0, screen);
width = (int)(width * scaleFactor + 0.5);
height = (int)(height * scaleFactor + 0.5);
GetDlgItem(buttonId)->SendMessage(BM_SETIMAGE, IMAGE_ICON, (LPARAM)::LoadImage(
AfxGetResourceHandle(), MAKEINTRESOURCE(iconId), IMAGE_ICON, width, height,
LR_DEFAULTCOLOR));
}
© 2023 Advanced Software Engineering Limited. All rights reserved.