[Qt Widgets version] qtdemo/megazoomscroll.cpp
#include "megazoomscroll.h"
#include <QPushButton>
#include <QThreadPool>
#include "chartdir.h"
#include <math.h>
#include <sstream>
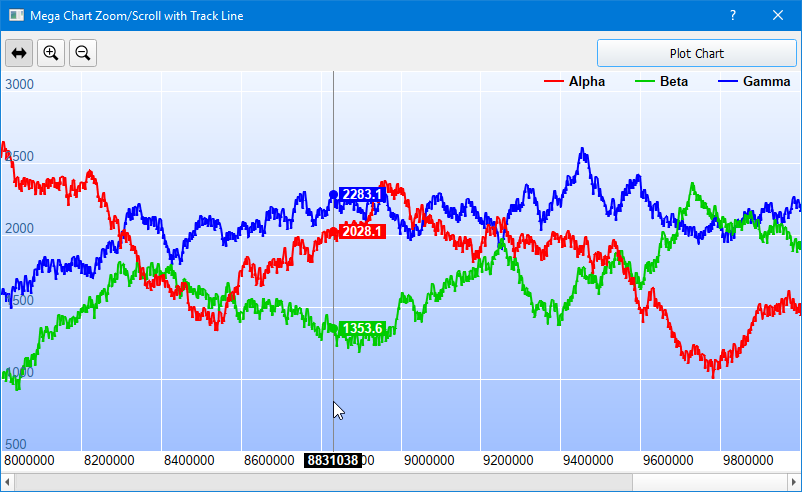
// In this example, we plot 3 data series, each with 10,000,000 data points.
// So the total is 30,000,000 data points.
static int bufferSize = 10000000;
MegaZoomScroll::MegaZoomScroll(QWidget *parent) :
QDialog(parent)
{
// Initialize member variables
m_fastData = 0;
m_hasFinishedInitialization = false;
//
// Set up the GUI
//
setFixedSize(800, 460);
setWindowTitle("Mega Chart Zoom/Scroll with Track Line");
// Pointer push button
QPushButton *pointerPB = new QPushButton(QIcon(":/icons/scroll_icon.png"), "", this);
pointerPB->setGeometry(4, 8, 28, 28);
pointerPB->setCheckable(true);
// Zoom In push button
QPushButton *zoomInPB = new QPushButton(QIcon(":/icons/zoomin_icon.png"), "", this);
zoomInPB->setGeometry(36, 8, 28, 28);
zoomInPB->setCheckable(true);
// Zoom Out push button
QPushButton *zoomOutPB = new QPushButton(QIcon(":/icons/zoomout_icon.png"), "", this);
zoomOutPB->setGeometry(68, 8, 28, 28);
zoomOutPB->setCheckable(true);
// The Pointer/Zoom In/Zoom Out buttons form a button group
mouseUsage = new QButtonGroup(this);
mouseUsage->addButton(pointerPB, Chart::MouseUsageScroll);
mouseUsage->addButton(zoomInPB, Chart::MouseUsageZoomIn);
mouseUsage->addButton(zoomOutPB, Chart::MouseUsageZoomOut);
connect(mouseUsage, SIGNAL(buttonPressed(QAbstractButton*)),
SLOT(onMouseUsageChanged(QAbstractButton*)));
// Plot Chart push button
QPushButton *plotChartPB = new QPushButton("Plot Chart", this);
plotChartPB->setGeometry(width() - 4 - 200, 8, 200, 28);
connect(plotChartPB, SIGNAL(clicked(bool)), SLOT(onClickPlotChart(bool)));
m_ChartViewer = new QChartViewer(this);
m_ChartViewer->setGeometry(0, 40, 600, 400);
connect(m_ChartViewer, SIGNAL(viewPortChanged()), SLOT(onViewPortChanged()));
connect(m_ChartViewer, SIGNAL(mouseMovePlotArea(QMouseEvent*)),
SLOT(onMouseMovePlotArea(QMouseEvent*)));
// Horizontal scroll bar
m_HScrollBar = new QScrollBar(Qt::Horizontal, this);
m_HScrollBar->setGeometry(0, height() - 18, width(), 18);
connect(m_HScrollBar, SIGNAL(valueChanged(int)), SLOT(onHScrollBarChanged(int)));
// Initially set the mouse to drag to scroll mode
pointerPB->click();
// Generate 3 x 10,000,000 random data points
loadData();
// Display initial Message
PieChart* c = new PieChart(800, 400, 0xd0e0ff);
c->addTitle(Chart::Center, "<*block,halign=left,maxwidth=500*>"
"<*font=Arial Bold,size=18,underline=2*>Mega Chart Zoom/Scroll with Track Line<*/font*>"
"<*br*><*br*>This example demonstrates a chart with huge amount of data. We limit "
"it to 3 lines, each with 10 million points, so that it uses less than 1G of RAM "
"(320M to store the data, 600M to plot the data and handle the GUI)."
"<*br*><*br*><*br*>Press the Plot Chart button to plot the chart.");
m_ChartViewer->setChart(c);
}
MegaZoomScroll::~MegaZoomScroll()
{
delete m_ChartViewer->getChart();
delete m_fastData;
}
// A thread task used for random number generator. Because of the large number of data
// points, we will create 3 random number generators running in 3 threads to speed up
// random number generation.
class RanSeriesTask : public QRunnable
{
private:
int seed; // random number seed
double* buffer; // buffer to store the result
int count; // the count of random numbers
public:
RanSeriesTask(int seed, double* buffer, int count)
: seed(seed), buffer(buffer), count(count)
{
}
virtual void run()
{
// Generate random numbers
RanSeries r(seed);
r.fillSeries(buffer, count, 2500, -1, 1);
}
};
// A thread task used for processing the data series in the data accelerator. We will
// create 3 threads so that 3 data series can be processed concurrently.
class FastSeriesTask : public QRunnable
{
private:
DataAccelerator* fastDB;
const char* id;
const double* data;
int len;
public:
FastSeriesTask(DataAccelerator* fastDB, const char* id, const double* data, int len)
: fastDB(fastDB), id(id), data(data), len(len)
{
}
virtual void run()
{
// Process the data series
fastDB->addDataSeries(id, data, len);
}
};
//
// Load the data
//
void MegaZoomScroll::loadData()
{
// Allocate space for the data arrays
m_dataSeriesA.resize(bufferSize);
m_dataSeriesB.resize(bufferSize);
m_dataSeriesC.resize(bufferSize);
m_timeStamps.resize(bufferSize);
// To speed up random number generation, we use 3 threads to generate the random data
// for the 3 data series. The current thread is used for generating the timestamps.
QThreadPool p;
p.start(new RanSeriesTask(109, &m_dataSeriesA[0], (int)m_dataSeriesA.size()));
p.start(new RanSeriesTask(110, &m_dataSeriesB[0], (int)m_dataSeriesB.size()));
p.start(new RanSeriesTask(111, &m_dataSeriesC[0], (int)m_dataSeriesC.size()));
for (int i = 0; i < (int)m_timeStamps.size(); ++i)
m_timeStamps[i] = i;
p.waitForDone();
}
//
// User clicks on the Plot Chart pushbutton
//
void MegaZoomScroll::onClickPlotChart(bool)
{
// Has already initialized ??
if (m_hasFinishedInitialization)
return;
// Use the DataAccerlerate the accelerate the rendering. To speed up, we create two
// threads to process two of the data series, and use the current thread to process
// the third series.
QThreadPool p;
m_fastData = new DataAccelerator(&m_timeStamps[0], (int)m_timeStamps.size());
p.start(new FastSeriesTask(m_fastData, "mA", &m_dataSeriesA[0], (int)m_dataSeriesA.size()));
p.start(new FastSeriesTask(m_fastData, "mB", &m_dataSeriesB[0], (int)m_dataSeriesB.size()));
m_fastData->addDataSeries("mC", &m_dataSeriesC[0], (int)m_dataSeriesC.size());
p.waitForDone();
// Initialize the CChartViewer
initChartViewer(m_ChartViewer);
m_hasFinishedInitialization = true;
// Trigger the ViewPortChanged event to draw the chart
m_ChartViewer->updateViewPort(true, true);
}
//
// Initialize the CChartViewer
//
void MegaZoomScroll::initChartViewer(QChartViewer* viewer)
{
// Set the full x range to be the duration of the data
viewer->setFullRange("x", m_timeStamps[0], m_timeStamps[m_timeStamps.size() - 1]);
// Initialize the view port to show the latest 20% of the time range
viewer->setViewPortWidth(0.2);
viewer->setViewPortLeft(1 - viewer->getViewPortWidth());
// Set the maximum zoom to 10 points
viewer->setZoomInWidthLimit(10.0 / m_timeStamps.size());
// Enable mouse wheel zooming by setting the zoom ratio to 1.1 per wheel event
viewer->setMouseWheelZoomRatio(1.1);
}
//
// The ViewPortChanged event handler. This event occurs if the user scrolls or zooms in
// or out the chart by dragging or clicking on the chart. It can also be triggered by
// calling WinChartViewer.updateViewPort.
//
void MegaZoomScroll::onViewPortChanged()
{
if (!m_hasFinishedInitialization)
return;
// In addition to updating the chart, we may also need to update other controls that
// changes based on the view port.
updateControls(m_ChartViewer);
// Update chart if necessary
if (m_ChartViewer->needUpdateChart())
drawChart(m_ChartViewer);
}
//
// Update controls in the user interface when the view port changed
//
void MegaZoomScroll::updateControls(QChartViewer *viewer)
{
// The logical length of the scrollbar. It can be any large value. The actual value does
// not matter.
const int scrollBarLen = 1000000000;
// Update the horizontal scroll bar
m_HScrollBar->setEnabled(viewer->getViewPortWidth() < 1);
m_HScrollBar->setPageStep((int)ceil(viewer->getViewPortWidth() * scrollBarLen));
m_HScrollBar->setSingleStep((std::min)(scrollBarLen / 100, m_HScrollBar->pageStep()));
m_HScrollBar->setRange(0, scrollBarLen - m_HScrollBar->pageStep());
m_HScrollBar->setValue((int)(0.5 + viewer->getViewPortLeft() * scrollBarLen));
}
//
// The Pointer, Zoom In or Zoom out button is pressed
//
void MegaZoomScroll::onMouseUsageChanged(QAbstractButton *b)
{
m_ChartViewer->setMouseUsage(mouseUsage->id(b));
}
//
// User clicks on the the horizontal scroll bar
//
void MegaZoomScroll::onHScrollBarChanged(int value)
{
if (m_hasFinishedInitialization && !m_ChartViewer->isInViewPortChangedEvent())
{
// Set the view port based on the scroll bar
int scrollBarLen = m_HScrollBar->maximum() + m_HScrollBar->pageStep();
m_ChartViewer->setViewPortLeft(value / (double)scrollBarLen);
// Update the chart display without updating the image maps. (We can delay updating
// the image map until scrolling is completed and the chart display is stable.)
m_ChartViewer->updateViewPort(true, false);
}
}
//
// Draw track cursor when mouse is moving over plotarea
//
void MegaZoomScroll::onMouseMovePlotArea(QMouseEvent *)
{
if (!m_hasFinishedInitialization)
return;
trackLineLabel((XYChart*)m_ChartViewer->getChart(), m_ChartViewer->getPlotAreaMouseX());
m_ChartViewer->updateDisplay();
}
//
// Draw the chart and display it in the given viewer
//
void MegaZoomScroll::drawChart(QChartViewer* viewer)
{
// Get the start date and end date that are visible on the chart.
double viewPortStartDate = viewer->getValueAtViewPort("x", viewer->getViewPortLeft());
double viewPortEndDate = viewer->getValueAtViewPort("x", viewer->getViewPortRight());
m_fastData->setSubsetRange(viewPortStartDate, viewPortEndDate);
//
// At this stage, we have extracted the visible data. We can use those data to plot the chart.
//
//================================================================================
// Configure overall chart appearance.
//================================================================================
XYChart* c = new XYChart(800, 400);
// Set the plotarea at (0, 0) with width 1 pixel less than chart width, and height 20 pixels
// less than chart height. Use a vertical gradient from light blue (f0f6ff) to sky blue (a0c0ff)
// as background. Set border to transparent and grid lines to white (ffffff).
c->setPlotArea(0, 0, c->getWidth() - 1, c->getHeight() - 20, c->linearGradientColor(0, 0, 0,
c->getHeight() - 20, 0xf0f6ff, 0xa0c0ff), -1, Chart::Transparent, 0xffffff, 0xffffff);
// In our code, we can overdraw the line slightly, so we clip it to the plot area.
c->setClipping();
// Add a legend box at the right side using horizontal layout. Use 10pt Arial Bold as font. Set
// the background and border color to Transparent and use line style legend key.
LegendBox* b = c->addLegend(c->getWidth() - 1, 10, false, "Arial Bold", 10);
b->setBackground(Chart::Transparent);
b->setAlignment(Chart::Right);
b->setLineStyleKey();
// Set the x and y axis stems to transparent and the label font to 10pt Arial
c->xAxis()->setColors(Chart::Transparent);
c->yAxis()->setColors(Chart::Transparent);
c->xAxis()->setLabelStyle("Arial", 10);
c->yAxis()->setLabelStyle("Arial", 10, 0x336699);
// Configure the y-axis label to be inside the plot area and above the horizontal grid lines
c->yAxis()->setLabelGap(-1);
c->yAxis()->setMargin(20);
c->yAxis()->setLabelAlignment(1);
// Configure the x-axis labels to be to the left of the vertical grid lines
c->xAxis()->setLabelAlignment(1);
//================================================================================
// Add data to chart
//================================================================================
//
// In this example, we represent the data by lines. You may modify the code below to use other
// representations (areas, scatter plot, etc).
//
// Add a line layer for the lines, using a line width of 2 pixels
LineLayer* layer = c->addLineLayer(m_fastData, "mA", 0xff0000, "Alpha");
layer->setLineWidth(2);
LineLayer* layer2 = c->addLineLayer(m_fastData, "mB", 0x00cc00, "Beta");
layer2->setLineWidth(2);
LineLayer* layer3 = c->addLineLayer(m_fastData, "mC", 0x0000ff, "Gamma");
layer3->setLineWidth(2);
//================================================================================
// Configure axis scale and labelling
//================================================================================
// Set the x-axis as a date/time axis with the scale according to the view port x range.
viewer->syncLinearAxisWithViewPort("x", c->xAxis());
// For the automatic axis labels, set the minimum spacing to 75/40 pixels for the x/y axis.
c->xAxis()->setTickDensity(75);
c->yAxis()->setTickDensity(40);
// Set the auto-scale margin to 0.05, and the zero affinity to 0.2
c->yAxis()->setAutoScale(0.05, 0.05, 0.2);
//================================================================================
// Output the chart
//================================================================================
// We need to update the track line too. If the mouse is moving on the chart (eg. if
// the user drags the mouse on the chart to scroll it), the track line will be updated
// in the MouseMovePlotArea event. Otherwise, we need to update the track line here.
if ((!viewer->isInMouseMoveEvent()) && viewer->isMouseOnPlotArea())
trackLineLabel(c, viewer->getPlotAreaMouseX());
delete viewer->getChart();
viewer->setChart(c);
}
//
// Draw the track line with legend
//
void MegaZoomScroll::trackLineLabel(XYChart* c, int mouseX)
{
// Obtain the dynamic layer of the chart
DrawArea* d = c->initDynamicLayer();
// The plot area object
PlotArea* plotArea = c->getPlotArea();
// Get the data x-value that is nearest to the mouse, and find its pixel coordinate.
double xValue = c->getNearestXValue(mouseX);
int xCoor = c->getXCoor(xValue);
if (xCoor < plotArea->getLeftX())
return;
// Draw a vertical track line at the x-position
d->vline(plotArea->getTopY(), plotArea->getBottomY(), xCoor, 0x888888);
// Draw a label on the x-axis to show the track line position.
std::ostringstream xlabel;
xlabel << "<*font,bgColor=000000*> " << c->formatValue(xValue, "{value}") << " <*/font*>";
TTFText* t = d->text(xlabel.str().c_str(), "Arial Bold", 10);
// Restrict the x-pixel position of the label to make sure it stays inside the chart image.
int xLabelPos = (std::max)(0, (std::min)(xCoor - t->getWidth() / 2, c->getWidth() - t->getWidth()));
t->draw(xLabelPos, plotArea->getBottomY() + 2, 0xffffff);
t->destroy();
// Iterate through all layers to draw the data labels
for (int i = 0; i < c->getLayerCount(); ++i) {
Layer* layer = c->getLayerByZ(i);
// The data array index of the x-value
int xIndex = layer->getXIndexOf(xValue);
// Iterate through all the data sets in the layer
for (int j = 0; j < layer->getDataSetCount(); ++j)
{
DataSet* dataSet = layer->getDataSetByZ(j);
const char* dataSetName = dataSet->getDataName();
// Get the color, name and position of the data label
int color = dataSet->getDataColor();
int yCoor = c->getYCoor(dataSet->getPosition(xIndex), dataSet->getUseYAxis());
// Draw a track dot with a label next to it for visible data points in the plot area
if ((yCoor >= plotArea->getTopY()) && (yCoor <= plotArea->getBottomY()) && (color !=
Chart::Transparent) && dataSetName && *dataSetName)
{
d->circle(xCoor, yCoor, 4, 4, color, color);
std::ostringstream label;
label << "<*font,bgColor=" << std::hex << color << "*> "
<< c->formatValue(dataSet->getValue(xIndex), "{value|P4}") << " <*font*>";
t = d->text(label.str().c_str(), "Arial Bold", 10);
// Draw the label on the right side of the dot if the mouse is on the left side the
// chart, and vice versa. This ensures the label will not go outside the chart image.
if (xCoor <= (plotArea->getLeftX() + plotArea->getRightX()) / 2)
t->draw(xCoor + 6, yCoor, 0xffffff, Chart::Left);
else
t->draw(xCoor - 6, yCoor, 0xffffff, Chart::Right);
t->destroy();
}
}
}
}
[QML/Qt Quick version] qmldemo/megazoomscroll.qml
import QtQuick
import QtQuick.Window
import QtQuick.Controls
import advsofteng.com 1.0

Window {
    title: "Mega Chart Zoom/Scroll with Track Line"
    visible: true
    modality: Qt.ApplicationModal
    width: 800
    minimumWidth: 800
    maximumWidth: 800
    height: 460
    minimumHeight: 460
    maximumHeight: 460

    Pane {
        id: buttonBar
        anchors.top: parent.top
        anchors.left: parent.left
        anchors.right: parent.right
        topPadding: 4
        height: 40

        Row {
            spacing: 5
            Button {
                icon.source: "icons/scroll_icon.png"
                icon.color: "transparent"
                checked: viewer.mouseUsage == QmlChartViewer.MouseUsageScroll
                onClicked: viewer.mouseUsage = QmlChartViewer.MouseUsageScroll
            }
            Button {
                icon.source: "icons/zoomin_icon.png"
                icon.color: "transparent"
                checked: viewer.mouseUsage == QmlChartViewer.MouseUsageZoomIn
                onClicked: viewer.mouseUsage = QmlChartViewer.MouseUsageZoomIn
            }
            Button {
                icon.source: "icons/zoomout_icon.png"
                icon.color: "transparent"
                checked: viewer.mouseUsage == QmlChartViewer.MouseUsageZoomOut
                onClicked: viewer.mouseUsage = QmlChartViewer.MouseUsageZoomOut
            }
        }

        Button {
            anchors.right: parent.right
            anchors.rightMargin: 5
            width: 200
            height: 32
            text: "Plot Chart"
            onClicked: {
                instructions.visible = false;
                this.enabled = false;
                demo.plotChart(viewer);
            }
        }
    }

    QmlChartViewer
    {
        id: viewer
        anchors.left: parent.left
        anchors.top: buttonBar.bottom

        // Set default mouse usage to scroll and mouse wheel to zoom
        mouseUsage: QmlChartViewer.MouseUsageScroll
        mouseWheelZoomRatio: 1.1
        // Update track cursor on mouse move
        onMouseMovePlotArea: demo.drawTrackCursor(this, chartMouseX);
        // Update chart on viewport change. Update the scrollbar too.
        onViewPortChanged: {
            if (needUpdateChart)
                demo.drawChart(this);

            hScrollBar.size = Math.min(viewer.viewPortWidth, 0.999999999);
            hScrollBar.position = viewer.viewPortLeft;
        }
    }

    Text {
        id: instructions;
        topPadding: 90
        width: 500
        anchors.top: buttonBar.bottom
        anchors.horizontalCenter: parent.horizontalCenter
        textFormat: Text.RichText
        wrapMode: Text.WordWrap
        text: "<div style='font-size:18pt;'><b>Mega Chart Zoom/Scroll with Track Line</b></div>
            <div style='font-size:12pt'>This example demonstrates a chart with huge amount of
            data. We limit it to 3 lines, each with 10 million points, so that it uses less
            than 1G of RAM (320M to store the data, 600M to plot the data and handle the GUI).
            <br><br><br>Press the Plot Chart button to plot the chart.</div>"
    }

    ScrollBar
    {
        id: hScrollBar
        orientation: Qt.Horizontal
        height: 18
        anchors.bottom: parent.bottom
        anchors.left: parent.left
        anchors.right: parent.right

        onPositionChanged: {
            // The scrollbar and viewport can update each others. To avoid infinite
            // loop, the scrollbar updates the viewport only if the viewport is not
            // updating the scrollbar.
            if (!viewer.isInViewPortChangedEvent) {
                // update the viewport
                viewer.viewPortLeft = this.position;
                viewer.updateViewPort(true, false);
            }
        }
    }

    // The backend implementation of this demo.
    MegaZoomScroll {
        id: demo;
    }
}
[QML/Qt Quick version] qmldemo/megazoomscroll.cpp
#include "megazoomscroll.h"
#include <QThreadPool>
#include <math.h>
#include <sstream>


// In this example, we plot 3 data series, each with 10,000,000 data points.
// So the total is 30,000,000 data points.
static int bufferSize = 10000000;


MegaZoomScroll::MegaZoomScroll(QObject *parent) : QObject(parent)
{
    // Initialize member variables
    m_currentChart = 0;
    m_fastData = 0;
    m_hasFinishedInitialization = false;

    // Generate 3 x 10,000,000 random data points
    loadData();
}


MegaZoomScroll::~MegaZoomScroll()
{
    delete m_currentChart;
    delete m_fastData;
}

// A thread task used for random number generator. Because of the large number of data
// points, we will create 3 random number generators running in 3 threads to speed up
// random number generation.
class RanSeriesTask : public QRunnable
{
private:
    int seed;            // random number seed
    double* buffer;      // buffer to store the result
    int count;           // the count of random numbers

public:
    RanSeriesTask(int seed, double* buffer, int count)
        : seed(seed), buffer(buffer), count(count)
    {
    }
    virtual void run()
    {
        // Generate random numbers
        RanSeries r(seed);
        r.fillSeries(buffer, count, 2500, -1, 1);
    }
};

// A thread task used for processing the data series in the data accelerator. We will
// create 3 threads so that 3 data series can be processed concurrently.
class FastSeriesTask : public QRunnable
{
private:
    DataAccelerator* fastDB;
    const char* id;
    const double* data;
    int len;

public:
    FastSeriesTask(DataAccelerator* fastDB, const char* id, const double* data, int len)
        : fastDB(fastDB), id(id), data(data), len(len)
    {
    }
    virtual void run()
    {
        // Process the data series
        fastDB->addDataSeries(id, data, len);
    }
};

//
// Load the data
//
void MegaZoomScroll::loadData()
{
    // Allocate space for the data arrays
    m_dataSeriesA.resize(bufferSize);
    m_dataSeriesB.resize(bufferSize);
    m_dataSeriesC.resize(bufferSize);
    m_timeStamps.resize(bufferSize);

    // To speed up random number generation, we use 3 threads to generate the random data
    // for the 3 data series. The current thread is used for generating the timestamps.
    QThreadPool p;

    p.start(new RanSeriesTask(109, &m_dataSeriesA[0], (int)m_dataSeriesA.size()));
    p.start(new RanSeriesTask(110, &m_dataSeriesB[0], (int)m_dataSeriesB.size()));
    p.start(new RanSeriesTask(111, &m_dataSeriesC[0], (int)m_dataSeriesC.size()));
    for (int i = 0; i < (int)m_timeStamps.size(); ++i)
        m_timeStamps[i] = i;

    p.waitForDone();
}

//
// User clicks on the Plot Chart pushbutton
//
void MegaZoomScroll::plotChart(QmlChartViewer *viewer)
{
    // Has already initialized ??
    if (m_hasFinishedInitialization)
        return;

    // Use the DataAccerlerate the accelerate the rendering. To speed up, we create two
    // threads to process two of the data series, and use the current thread to process
    // the third series.
    QThreadPool p;

    m_fastData = new DataAccelerator(&m_timeStamps[0], (int)m_timeStamps.size());
    p.start(new FastSeriesTask(m_fastData, "mA", &m_dataSeriesA[0], (int)m_dataSeriesA.size()));
    p.start(new FastSeriesTask(m_fastData, "mB", &m_dataSeriesB[0], (int)m_dataSeriesB.size()));
    m_fastData->addDataSeries("mC", &m_dataSeriesC[0], (int)m_dataSeriesC.size());
    p.waitForDone();

    // Initialize the CChartViewer
    initChartViewer(viewer);
    m_hasFinishedInitialization = true;

    // Trigger the ViewPortChanged event to draw the chart
    viewer->updateViewPort(true, true);
}

//
// Initialize the CChartViewer
//
void MegaZoomScroll::initChartViewer(QmlChartViewer* viewer)
{
    // Set the full x range to be the duration of the data
    viewer->setFullRange("x", m_timeStamps[0], m_timeStamps[m_timeStamps.size() - 1]);

    // Initialize the view port to show the latest 20% of the time range
    viewer->setViewPortWidth(0.2);
    viewer->setViewPortLeft(1 - viewer->getViewPortWidth());

    // Set the maximum zoom to 10 points
    viewer->setZoomInWidthLimit(10.0 / m_timeStamps.size());

    // Enable mouse wheel zooming by setting the zoom ratio to 1.1 per wheel event
    viewer->setMouseWheelZoomRatio(1.1);
}

//
// Draw track cursor when mouse is moving over plotarea
//
void MegaZoomScroll::drawTrackCursor(QmlChartViewer *viewer, int mouseX)
{
    if (!m_hasFinishedInitialization)
        return;

    trackLineLabel((XYChart*)viewer->getChart(), mouseX);
    viewer->updateDisplay();
}

//
// Draw the chart and display it in the given viewer
//
void MegaZoomScroll::drawChart(QmlChartViewer* viewer)
{
    // Get the start date and end date that are visible on the chart.
    double viewPortStartDate = viewer->getValueAtViewPort("x", viewer->getViewPortLeft());
    double viewPortEndDate = viewer->getValueAtViewPort("x", viewer->getViewPortRight());
    m_fastData->setSubsetRange(viewPortStartDate, viewPortEndDate);

    //
    // At this stage, we have extracted the visible data. We can use those data to plot the chart.
    //

    //================================================================================
    // Configure overall chart appearance.
    //================================================================================

    XYChart* c = new XYChart(800, 400);

    // Set the plotarea at (0, 0) with width 1 pixel less than chart width, and height 20 pixels
    // less than chart height. Use a vertical gradient from light blue (f0f6ff) to sky blue (a0c0ff)
    // as background. Set border to transparent and grid lines to white (ffffff).
    c->setPlotArea(0, 0, c->getWidth() - 1, c->getHeight() - 20, c->linearGradientColor(0, 0, 0,
        c->getHeight() - 20, 0xf0f6ff, 0xa0c0ff), -1, Chart::Transparent, 0xffffff, 0xffffff);

    // In our code, we can overdraw the line slightly, so we clip it to the plot area.
    c->setClipping();

    // Add a legend box at the right side using horizontal layout. Use 10pt Arial Bold as font. Set
    // the background and border color to Transparent and use line style legend key.
    LegendBox* b = c->addLegend(c->getWidth() - 1, 10, false, "Arial Bold", 10);
    b->setBackground(Chart::Transparent);
    b->setAlignment(Chart::Right);
    b->setLineStyleKey();

    // Set the x and y axis stems to transparent and the label font to 10pt Arial
    c->xAxis()->setColors(Chart::Transparent);
    c->yAxis()->setColors(Chart::Transparent);
    c->xAxis()->setLabelStyle("Arial", 10);
    c->yAxis()->setLabelStyle("Arial", 10, 0x336699);

    // Configure the y-axis label to be inside the plot area and above the horizontal grid lines
    c->yAxis()->setLabelGap(-1);
    c->yAxis()->setMargin(20);
    c->yAxis()->setLabelAlignment(1);

    // Configure the x-axis labels to be to the left of the vertical grid lines
    c->xAxis()->setLabelAlignment(1);

    //================================================================================
    // Add data to chart
    //================================================================================

    //
    // In this example, we represent the data by lines. You may modify the code below to use other
    // representations (areas, scatter plot, etc).
    //

    // Add a line layer for the lines, using a line width of 2 pixels
    LineLayer* layer = c->addLineLayer(m_fastData, "mA", 0xff0000, "Alpha");
    layer->setLineWidth(2);

    LineLayer* layer2 = c->addLineLayer(m_fastData, "mB", 0x00cc00, "Beta");
    layer2->setLineWidth(2);

    LineLayer* layer3 = c->addLineLayer(m_fastData, "mC", 0x0000ff, "Gamma");
    layer3->setLineWidth(2);

    //================================================================================
    // Configure axis scale and labelling
    //================================================================================

    // Set the x-axis as a date/time axis with the scale according to the view port x range.
    viewer->syncLinearAxisWithViewPort("x", c->xAxis());

    // For the automatic axis labels, set the minimum spacing to 75/40 pixels for the x/y axis.
    c->xAxis()->setTickDensity(75);
    c->yAxis()->setTickDensity(40);

    // Set the auto-scale margin to 0.05, and the zero affinity to 0.2
    c->yAxis()->setAutoScale(0.05, 0.05, 0.2);

    //================================================================================
    // Output the chart
    //================================================================================

    // We need to update the track line too. If the mouse is moving on the chart (eg. if
    // the user drags the mouse on the chart to scroll it), the track line will be updated
    // in the MouseMovePlotArea event. Otherwise, we need to update the track line here.
    if ((!viewer->isInMouseMoveEvent()) && viewer->isMouseOnPlotArea())
        trackLineLabel(c, viewer->getPlotAreaMouseX());

    delete viewer->getChart();
    viewer->setChart(m_currentChart = c);
}

//
// Draw the track line with legend
//
void MegaZoomScroll::trackLineLabel(XYChart* c, int mouseX)
{
    // Obtain the dynamic layer of the chart
    DrawArea* d = c->initDynamicLayer();

    // The plot area object
    PlotArea* plotArea = c->getPlotArea();

    // Get the data x-value that is nearest to the mouse, and find its pixel coordinate.
    double xValue = c->getNearestXValue(mouseX);
    int xCoor = c->getXCoor(xValue);
    if (xCoor < plotArea->getLeftX())
        return;

    // Draw a vertical track line at the x-position
    d->vline(plotArea->getTopY(), plotArea->getBottomY(), xCoor, 0x888888);

    // Draw a label on the x-axis to show the track line position.
    std::ostringstream xlabel;
    xlabel << "<*font,bgColor=000000*> " << c->formatValue(xValue, "{value}") << " <*/font*>";
    TTFText* t = d->text(xlabel.str().c_str(), "Arial Bold", 10);

    // Restrict the x-pixel position of the label to make sure it stays inside the chart image.
    int xLabelPos = (std::max)(0, (std::min)(xCoor - t->getWidth() / 2, c->getWidth() - t->getWidth()));
    t->draw(xLabelPos, plotArea->getBottomY() + 2, 0xffffff);
    t->destroy();

    // Iterate through all layers to draw the data labels
    for (int i = 0; i < c->getLayerCount(); ++i) {
        Layer* layer = c->getLayerByZ(i);

        // The data array index of the x-value
        int xIndex = layer->getXIndexOf(xValue);

        // Iterate through all the data sets in the layer
        for (int j = 0; j < layer->getDataSetCount(); ++j)
        {
            DataSet* dataSet = layer->getDataSetByZ(j);
            const char* dataSetName = dataSet->getDataName();

            // Get the color, name and position of the data label
            int color = dataSet->getDataColor();
            int yCoor = c->getYCoor(dataSet->getPosition(xIndex), dataSet->getUseYAxis());

            // Draw a track dot with a label next to it for visible data points in the plot area
            if ((yCoor >= plotArea->getTopY()) && (yCoor <= plotArea->getBottomY()) && (color !=
                Chart::Transparent) && dataSetName && *dataSetName)
            {
                d->circle(xCoor, yCoor, 4, 4, color, color);

                std::ostringstream label;
                label << "<*font,bgColor=" << std::hex << color << "*> "
                    << c->formatValue(dataSet->getValue(xIndex), "{value|P4}") << " <*font*>";
                t = d->text(label.str().c_str(), "Arial Bold", 10);

                // Draw the label on the right side of the dot if the mouse is on the left side the
                // chart, and vice versa. This ensures the label will not go outside the chart image.
                if (xCoor <= (plotArea->getLeftX() + plotArea->getRightX()) / 2)
                    t->draw(xCoor + 6, yCoor, 0xffffff, Chart::Left);
                else
                    t->draw(xCoor - 6, yCoor, 0xffffff, Chart::Right);

                t->destroy();
            }
        }
    }
}
© 2023 Advanced Software Engineering Limited. All rights reserved.