The following is the command line version of the code in "cppdemo/multiline". The MFC version of the code is in "mfcdemo/mfcdemo". The Qt Widgets version of the code is in "qtdemo/qtdemo". The QML/Qt Quick version of the code is in "qmldemo/qmldemo".
#include "chartdir.h"
int main(int argc, char *argv[])
{
// The data for the line chart
double data0[] = {42, 49, 33, 38, 51, 46, 29, 41, 44, 57, 59, 52, 37, 34, 51, 56, 56, 60, 70,
76, 63, 67, 75, 64, 51};
const int data0_size = (int)(sizeof(data0)/sizeof(*data0));
double data1[] = {50, 55, 47, 34, 42, 49, 63, 62, 73, 59, 56, 50, 64, 60, 67, 67, 58, 59, 73,
77, 84, 82, 80, 84, 98};
const int data1_size = (int)(sizeof(data1)/sizeof(*data1));
double data2[] = {36, 28, 25, 33, 38, 20, 22, 30, 25, 33, 30, 24, 28, 15, 21, 26, 46, 42, 48,
45, 43, 52, 64, 60, 70};
const int data2_size = (int)(sizeof(data2)/sizeof(*data2));
// The labels for the line chart
const char* labels[] = {"0", "1", "2", "3", "4", "5", "6", "7", "8", "9", "10", "11", "12",
"13", "14", "15", "16", "17", "18", "19", "20", "21", "22", "23", "24"};
const int labels_size = (int)(sizeof(labels)/sizeof(*labels));
// Create an XYChart object of size 600 x 300 pixels, with a light blue (EEEEFF) background,
// black border, 1 pxiel 3D border effect and rounded corners
XYChart* c = new XYChart(600, 300, 0xeeeeff, 0x000000, 1);
c->setRoundedFrame();
// Set the plotarea at (55, 58) and of size 520 x 195 pixels, with white background. Turn on
// both horizontal and vertical grid lines with light grey color (0xcccccc)
c->setPlotArea(55, 58, 520, 195, 0xffffff, -1, -1, 0xcccccc, 0xcccccc);
// Add a legend box at (50, 30) (top of the chart) with horizontal layout. Use 9pt Arial Bold
// font. Set the background and border color to Transparent.
c->addLegend(50, 30, false, "Arial Bold", 9)->setBackground(Chart::Transparent);
// Add a title box to the chart using 15pt Times Bold Italic font, on a light blue (CCCCFF)
// background with glass effect. white (0xffffff) on a dark red (0x800000) background, with a 1
// pixel 3D border.
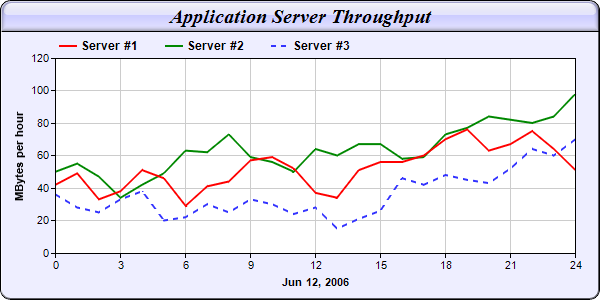
c->addTitle("Application Server Throughput", "Times New Roman Bold Italic", 15)->setBackground(
0xccccff, 0x000000, Chart::glassEffect());
// Add a title to the y axis
c->yAxis()->setTitle("MBytes per hour");
// Set the labels on the x axis.
c->xAxis()->setLabels(StringArray(labels, labels_size));
// Display 1 out of 3 labels on the x-axis.
c->xAxis()->setLabelStep(3);
// Add a title to the x axis
c->xAxis()->setTitle("Jun 12, 2006");
// Add a line layer to the chart
LineLayer* layer = c->addLineLayer();
// Set the default line width to 2 pixels
layer->setLineWidth(2);
// Add the three data sets to the line layer. For demo purpose, we use a dash line color for the
// last line
layer->addDataSet(DoubleArray(data0, data0_size), 0xff0000, "Server #1");
layer->addDataSet(DoubleArray(data1, data1_size), 0x008800, "Server #2");
layer->addDataSet(DoubleArray(data2, data2_size), c->dashLineColor(0x3333ff, Chart::DashLine),
"Server #3");
// Output the chart
c->makeChart("multiline.png");
//free up resources
delete c;
return 0;
}
© 2023 Advanced Software Engineering Limited. All rights reserved.