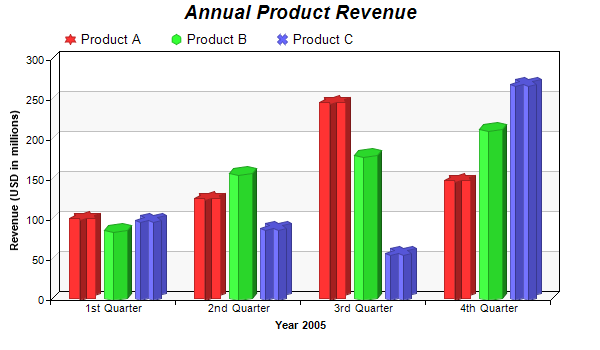
This example demonstrates a multi-bar chart in which each data set has a different bar shape.
The bar shapes are specified using BarLayer.setBarShape. See Shape Specification on how built-in and custom shapes are defined in ChartDirector.
ChartDirector 7.1 (C++ Edition)
Multi-Shape Bar Chart
Source Code Listing
#include "chartdir.h"

int main(int argc, char *argv[])
{
    // The data for the bar chart
    double data0[] = {100, 125, 245, 147};
    const int data0_size = (int)(sizeof(data0)/sizeof(*data0));
    double data1[] = {85, 156, 179, 211};
    const int data1_size = (int)(sizeof(data1)/sizeof(*data1));
    double data2[] = {97, 87, 56, 267};
    const int data2_size = (int)(sizeof(data2)/sizeof(*data2));
    const char* labels[] = {"1st Quarter", "2nd Quarter", "3rd Quarter", "4th Quarter"};
    const int labels_size = (int)(sizeof(labels)/sizeof(*labels));

    // Create a XYChart object of size 600 x 350 pixels
    XYChart* c = new XYChart(600, 350);

    // Add a title to the chart using 14pt Arial Bold Italic font
    c->addTitle("Annual Product Revenue", "Arial Bold Italic", 14);

    // Set the plot area at (50, 60) and of size 500 x 240. Use two alternative background colors
    // (f8f8f8 and ffffff)
    c->setPlotArea(50, 60, 500, 240, 0xf8f8f8, 0xffffff);

    // Add a legend box at (55, 22) using horizontal layout, with transparent background
    c->addLegend(55, 22, false)->setBackground(Chart::Transparent);

    // Set the x axis labels
    c->xAxis()->setLabels(StringArray(labels, labels_size));

    // Draw the ticks between label positions (instead of at label positions)
    c->xAxis()->setTickOffset(0.5);

    // Add a multi-bar layer with 3 data sets and 9 pixels 3D depth
    BarLayer* layer = c->addBarLayer(Chart::Side, 9);
    layer->addDataSet(DoubleArray(data0, data0_size), -1, "Product A");
    layer->addDataSet(DoubleArray(data1, data1_size), -1, "Product B");
    layer->addDataSet(DoubleArray(data2, data2_size), -1, "Product C");

    // Set data set 1 to use a bar shape of a 6-pointed star
    layer->setBarShape(Chart::StarShape(6), 0);

    // Set data set 2 to use a bar shapre of a 6-sided polygon
    layer->setBarShape(Chart::PolygonShape(6), 1);

    // Set data set 3 to use an X bar shape
    layer->setBarShape(Chart::Cross2Shape(), 2);

    // Add a title to the y-axis
    c->yAxis()->setTitle("Revenue (USD in millions)");

    // Add a title to the x axis
    c->xAxis()->setTitle("Year 2005");

    // Output the chart
    c->makeChart("multishapebar.png");

    //free up resources
    delete c;

    return 0;
}