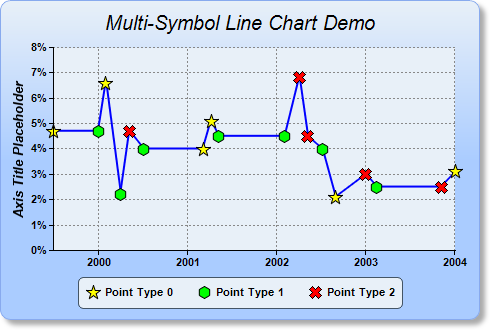
This example demonstrates a line with different symbols for different data points. It also demonstrates unevenly spaced data points on an auto-scaled true date/time axis, and automatic resizing of the plot area to fit the chart.
The chart in this example is created by using a line layer for the line, and using multiple scatter layers for different types of symbols. The scatter layers are created first using
XYChart.addScatterLayer, followed by the line layer using
XYChart.addLineLayer. This ensures the symbols stays on top of the line.
The
ArrayMath utility, through the
ArrayMath.selectEQZ and
ArrayMath.sub methods, is used to select the subset of data to be used for various symbols.
Note that in this example, the data points are unevenly spaced, and the x coordinates are real date/time. The x coordinates are set into the scatter layer as the first argument to
XYChart.addScatterLayer, and into the line layer using
Layer.setXData. As the x-axis scale is not configured, ChartDirector auto-scales the x-axis to fit the data.
After the entire chart is configured, the
XYChart.packPlotArea method is used to adjust the plot area size, so as to fit the plot area and the axes in a given bounding box.
The following is the command line version of the code in "cppdemo/multisymbolline". The MFC version of the code is in "mfcdemo/mfcdemo". The Qt Widgets version of the code is in "qtdemo/qtdemo". The QML/Qt Quick version of the code is in "qmldemo/qmldemo".
#include "chartdir.h"

int main(int argc, char *argv[])
{
    // In this example, the data points are unevenly spaced on the x-axis
    double dataY[] = {4.7, 4.7, 6.6, 2.2, 4.7, 4.0, 4.0, 5.1, 4.5, 4.5, 6.8, 4.5, 4, 2.1, 3, 2.5,
        2.5, 3.1};
    const int dataY_size = (int)(sizeof(dataY)/sizeof(*dataY));
    double dataX[] = {Chart::chartTime(1999, 7, 1), Chart::chartTime(2000, 1, 1), Chart::chartTime(
        2000, 2, 1), Chart::chartTime(2000, 4, 1), Chart::chartTime(2000, 5, 8), Chart::chartTime(
        2000, 7, 5), Chart::chartTime(2001, 3, 5), Chart::chartTime(2001, 4, 7), Chart::chartTime(
        2001, 5, 9), Chart::chartTime(2002, 2, 4), Chart::chartTime(2002, 4, 4), Chart::chartTime(
        2002, 5, 8), Chart::chartTime(2002, 7, 7), Chart::chartTime(2002, 8, 30), Chart::chartTime(
        2003, 1, 2), Chart::chartTime(2003, 2, 16), Chart::chartTime(2003, 11, 6), Chart::chartTime(
        2004, 1, 4)};
    const int dataX_size = (int)(sizeof(dataX)/sizeof(*dataX));

    // Data points are assigned different symbols based on point type
    double pointType[] = {0, 1, 0, 1, 2, 1, 0, 0, 1, 1, 2, 2, 1, 0, 2, 1, 2, 0};
    const int pointType_size = (int)(sizeof(pointType)/sizeof(*pointType));

    // Create a XYChart object of size 480 x 320 pixels. Use a vertical gradient color from pale
    // blue (e8f0f8) to sky blue (aaccff) spanning half the chart height as background. Set border
    // to blue (88aaee). Use rounded corners. Enable soft drop shadow.
    XYChart* c = new XYChart(480, 320);
    c->setBackground(c->linearGradientColor(0, 0, 0, c->getHeight() / 2, 0xe8f0f8, 0xaaccff),
        0x88aaee);
    c->setRoundedFrame();
    c->setDropShadow();

    // Add a title to the chart using 15 points Arial Italic font. Set top/bottom margins to 12
    // pixels.
    TextBox* title = c->addTitle("Multi-Symbol Line Chart Demo", "Arial Italic", 15);
    title->setMargin(0, 0, 12, 12);

    // Tentatively set the plotarea to 50 pixels from the left edge to allow for the y-axis, and to
    // just under the title. Set the width to 65 pixels less than the chart width, and the height to
    // reserve 90 pixels at the bottom for the x-axis and the legend box. Use pale blue (e8f0f8)
    // background, transparent border, and grey (888888) dotted horizontal and vertical grid lines.
    c->setPlotArea(50, title->getHeight(), c->getWidth() - 65, c->getHeight() - title->getHeight() -
        90, 0xe8f0f8, -1, Chart::Transparent, c->dashLineColor(0x888888, Chart::DotLine), -1);

    // Add a legend box where the bottom-center is anchored to the 12 pixels above the bottom-center
    // of the chart. Use horizontal layout and 8 points Arial font.
    LegendBox* legendBox = c->addLegend(c->getWidth() / 2, c->getHeight() - 12, false, "Arial Bold",
        8);
    legendBox->setAlignment(Chart::BottomCenter);

    // Set the legend box background and border to pale blue (e8f0f8) and bluish grey (445566)
    legendBox->setBackground(0xe8f0f8, 0x445566);

    // Use rounded corners of 5 pixel radius for the legend box
    legendBox->setRoundedCorners(5);

    // Set the y axis label format to display a percentage sign
    c->yAxis()->setLabelFormat("{value}%");

    // Set y-axis title to use 10 points Arial Bold Italic font
    c->yAxis()->setTitle("Axis Title Placeholder", "Arial Bold Italic", 10);

    // Set axis labels to use Arial Bold font
    c->yAxis()->setLabelStyle("Arial Bold");
    c->xAxis()->setLabelStyle("Arial Bold");

    // We add the different data symbols using scatter layers. The scatter layers are added before
    // the line layer to make sure the data symbols stay on top of the line layer.

    // We select the points with pointType = 0 (the non-selected points will be set to NoValue), and
    // use yellow (ffff00) 15 pixels high 5 pointed star shape symbols for the points. (This example
    // uses both x and y coordinates. For charts that have no x explicitly coordinates, use an empty
    // array as dataX.)
    c->addScatterLayer(DoubleArray(dataX, dataX_size), ArrayMath(DoubleArray(dataY, dataY_size)
        ).selectEQZ(DoubleArray(pointType, pointType_size), Chart::NoValue), "Point Type 0",
        Chart::StarShape(5), 15, 0xffff00);

    // Similar to above, we select the points with pointType - 1 = 0 and use green (ff00) 13 pixels
    // high six-sided polygon as symbols.
    c->addScatterLayer(DoubleArray(dataX, dataX_size), ArrayMath(DoubleArray(dataY, dataY_size)
        ).selectEQZ(ArrayMath(DoubleArray(pointType, pointType_size)).sub(1), Chart::NoValue),
        "Point Type 1", Chart::PolygonShape(6), 13, 0x00ff00);

    // Similar to above, we select the points with pointType - 2 = 0 and use red (ff0000) 13 pixels
    // high X shape as symbols.
    c->addScatterLayer(DoubleArray(dataX, dataX_size), ArrayMath(DoubleArray(dataY, dataY_size)
        ).selectEQZ(ArrayMath(DoubleArray(pointType, pointType_size)).sub(2), Chart::NoValue),
        "Point Type 2", Chart::Cross2Shape(), 13, 0xff0000);

    // Finally, add a blue (0000ff) line layer with line width of 2 pixels
    LineLayer* layer = c->addLineLayer(DoubleArray(dataY, dataY_size), 0x0000ff);
    layer->setXData(DoubleArray(dataX, dataX_size));
    layer->setLineWidth(2);

    // Adjust the plot area size, such that the bounding box (inclusive of axes) is 10 pixels from
    // the left edge, just below the title, 25 pixels from the right edge, and 8 pixels above the
    // legend box.
    c->packPlotArea(10, title->getHeight(), c->getWidth() - 25, c->layoutLegend()->getTopY() - 8);

    // Output the chart
    c->makeChart("multisymbolline.png");

    //free up resources
    delete c;

    return 0;
}
© 2023 Advanced Software Engineering Limited. All rights reserved.