The following is the command line version of the code in "cppdemo/percentarea". The MFC version of the code is in "mfcdemo/mfcdemo". The Qt Widgets version of the code is in "qtdemo/qtdemo". The QML/Qt Quick version of the code is in "qmldemo/qmldemo".
#include "chartdir.h"
int main(int argc, char *argv[])
{
// The data for the area chart
double data0[] = {42, 49, 33, 38, 51, 46, 29, 41, 44, 57, 59, 52, 37, 34, 51, 56, 56, 60, 70,
76, 63, 67, 75, 64, 51};
const int data0_size = (int)(sizeof(data0)/sizeof(*data0));
double data1[] = {50, 55, 47, 34, 42, 49, 63, 62, 73, 59, 56, 50, 64, 60, 67, 67, 58, 59, 73,
77, 84, 82, 80, 84, 98};
const int data1_size = (int)(sizeof(data1)/sizeof(*data1));
double data2[] = {87, 89, 85, 66, 53, 39, 24, 21, 37, 56, 37, 23, 21, 33, 13, 17, 14, 23, 16,
25, 29, 30, 45, 47, 46};
const int data2_size = (int)(sizeof(data2)/sizeof(*data2));
// The timestamps on the x-axis
double labels[] = {Chart::chartTime(1996, 1, 1), Chart::chartTime(1996, 4, 1), Chart::chartTime(
1996, 7, 1), Chart::chartTime(1996, 10, 1), Chart::chartTime(1997, 1, 1), Chart::chartTime(
1997, 4, 1), Chart::chartTime(1997, 7, 1), Chart::chartTime(1997, 10, 1), Chart::chartTime(
1998, 1, 1), Chart::chartTime(1998, 4, 1), Chart::chartTime(1998, 7, 1), Chart::chartTime(
1998, 10, 1), Chart::chartTime(1999, 1, 1), Chart::chartTime(1999, 4, 1), Chart::chartTime(
1999, 7, 1), Chart::chartTime(1999, 10, 1), Chart::chartTime(2000, 1, 1), Chart::chartTime(
2000, 4, 1), Chart::chartTime(2000, 7, 1), Chart::chartTime(2000, 10, 1), Chart::chartTime(
2001, 1, 1), Chart::chartTime(2001, 4, 1), Chart::chartTime(2001, 7, 1), Chart::chartTime(
2001, 10, 1), Chart::chartTime(2002, 1, 1)};
const int labels_size = (int)(sizeof(labels)/sizeof(*labels));
// Create a XYChart object of size 500 x 280 pixels, using 0xffffcc as background color, with a
// black border, and 1 pixel 3D border effect
XYChart* c = new XYChart(500, 280, 0xffffcc, 0, 1);
// Set the plotarea at (50, 45) and of size 320 x 200 pixels with white background. Enable
// horizontal and vertical grid lines using the grey (0xc0c0c0) color.
c->setPlotArea(50, 45, 320, 200, 0xffffff)->setGridColor(0xc0c0c0, 0xc0c0c0);
// Add a legend box at (370, 45) using vertical layout and 8 points Arial Bold font.
LegendBox* legendBox = c->addLegend(370, 45, true, "Arial Bold", 8);
// Set the legend box background and border to transparent
legendBox->setBackground(Chart::Transparent, Chart::Transparent);
// Set the legend box icon size to 16 x 32 pixels to match with custom icon size
legendBox->setKeySize(16, 32);
// Add a title to the chart using 14 points Times Bold Itatic font and white font color, and
// 0x804020 as the background color
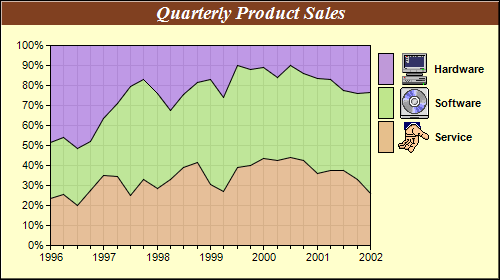
c->addTitle("Quarterly Product Sales", "Times New Roman Bold Italic", 14, 0xffffff
)->setBackground(0x804020);
// Set the labels on the x axis.
c->xAxis()->setLabels(DoubleArray(labels, labels_size));
// Set multi-style axis label formatting. Start of year labels are displayed as yyyy. For other
// labels, just show minor tick.
c->xAxis()->setMultiFormat(Chart::StartOfYearFilter(), "{value|yyyy}", Chart::AllPassFilter(),
"-");
// Add a percentage area layer to the chart
AreaLayer* layer = c->addAreaLayer(Chart::Percentage);
// Add the three data sets to the area layer, using icons images with labels as data set names
layer->addDataSet(DoubleArray(data0, data0_size), 0x40ddaa77,
"<*block,valign=absmiddle*><*img=service.png*> Service<*/*>");
layer->addDataSet(DoubleArray(data1, data1_size), 0x40aadd77,
"<*block,valign=absmiddle*><*img=software.png*> Software<*/*>");
layer->addDataSet(DoubleArray(data2, data2_size), 0x40aa77dd,
"<*block,valign=absmiddle*><*img=computer.png*> Hardware<*/*>");
// For a vertical stacked chart with positive data only, the last data set is always on top.
// However, in a vertical legend box, the last data set is at the bottom. This can be reversed
// by using the setLegend method.
layer->setLegend(Chart::ReverseLegend);
// Output the chart
c->makeChart("percentarea.png");
//free up resources
delete c;
return 0;
}
© 2023 Advanced Software Engineering Limited. All rights reserved.