[MFC version] mfcdemo/RealTimeMultiChartDlg.cpp
//
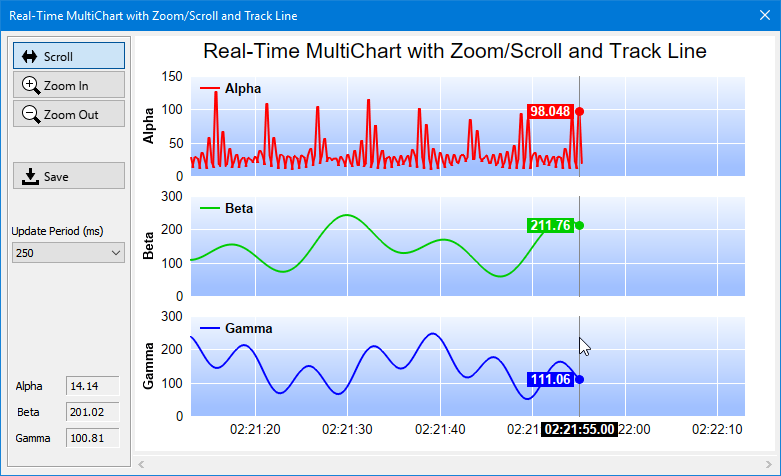
// Real Time Multi-Chart sample code
//
#include "stdafx.h"
#include "resource.h"
#include "RealTimeMultiChartDlg.h"
#include <math.h>
#include <vector>
#include <string>
#include <algorithm>
#include <sstream>
#ifdef _DEBUG
#define new DEBUG_NEW
#endif
//
// The DataRateTimerId is for the timer that gets real-time data. In real applications,
// the data can be updated by a timer or other methods. In this example, this timer is
// set to 250ms.
//
// The ChartUpdateTimerId is for the timer that updates the chart. In this example,
// the user can choose the chart update rate from the user interface.
//
static const int DataRateTimerId = 1;
static const int ChartUpdateTimerId = 2;
static const int DataInterval = 250;
//
// The height of each XYChart. The bottom chart has an extra height for the x-axis labels.
//
static const int chartHeight = 120;
static const int xAxisHeight = 25;
//
// Constructor
//
CRealTimeMultiChartDlg::CRealTimeMultiChartDlg(CWnd* pParent /*=NULL*/)
: CDialog(IDD_REALTIMEMULTICHART, pParent)
{
// Initialize variables
for (int i = 0; i < sampleSize; ++i)
m_timeStamps[i] = m_dataSeriesA[i] = m_dataSeriesB[i] = m_dataSeriesC[i] = Chart::NoValue;
m_nextDataTime = m_currentIndex = 0;
}
//
// Destructor
//
CRealTimeMultiChartDlg::~CRealTimeMultiChartDlg()
{
deleteMultiChart((MultiChart*)m_ChartViewer.getChart());
}
void CRealTimeMultiChartDlg::DoDataExchange(CDataExchange* pDX)
{
CDialog::DoDataExchange(pDX);
DDX_Control(pDX, IDC_GammaValue, m_ValueC);
DDX_Control(pDX, IDC_BetaValue, m_ValueB);
DDX_Control(pDX, IDC_AlphaValue, m_ValueA);
DDX_Control(pDX, IDC_ChartViewer, m_ChartViewer);
DDX_Control(pDX, IDC_UpdatePeriod, m_UpdatePeriod);
DDX_Control(pDX, IDC_PointerPB, m_PointerPB);
DDX_Control(pDX, IDC_HScrollBar, m_HScrollBar);
}
BEGIN_MESSAGE_MAP(CRealTimeMultiChartDlg, CDialog)
ON_WM_TIMER()
ON_CBN_SELCHANGE(IDC_UpdatePeriod, OnSelchangeUpdatePeriod)
ON_CONTROL(CVN_ViewPortChanged, IDC_ChartViewer, OnViewPortChanged)
ON_CONTROL(CVN_MouseMovePlotArea, IDC_ChartViewer, OnMouseMovePlotArea)
ON_BN_CLICKED(IDC_PointerPB, OnPointerPB)
ON_BN_CLICKED(IDC_ZoomInPB, OnZoomInPB)
ON_BN_CLICKED(IDC_ZoomOutPB, OnZoomOutPB)
ON_BN_CLICKED(IDC_SavePB, OnSavePB)
ON_WM_HSCROLL()
END_MESSAGE_MAP()
//
// Initialization
//
BOOL CRealTimeMultiChartDlg::OnInitDialog()
{
CDialog::OnInitDialog();
// Set m_nextDataTime to the current time. It is used by the real time random number
// generator so it knows what timestamp should be used for the next data point.
SYSTEMTIME st;
GetLocalTime(&st);
m_nextDataTime = Chart::chartTime(st.wYear, st.wMonth, st.wDay, st.wHour, st.wMinute,
st.wSecond);
// Load icons for the buttons
loadButtonIcon(IDC_PointerPB, IDI_PointerPB, 100, 20);
loadButtonIcon(IDC_ZoomInPB, IDI_ZoomInPB, 100, 20);
loadButtonIcon(IDC_ZoomOutPB, IDI_ZoomOutPB, 100, 20);
loadButtonIcon(IDC_SavePB, IDI_SavePB, 100, 20);
// Initially set the mouse to drag to scroll mode.
m_PointerPB.SetCheck(1);
m_ChartViewer.setMouseUsage(Chart::MouseUsageScroll);
// Enable mouse wheel zooming by setting the zoom ratio to 1.1 per wheel event
m_ChartViewer.setMouseWheelZoomRatio(1.1);
// Set up the data acquisition mechanism. In this demo, we just use a timer to get a
// sample every 250ms.
SetTimer(DataRateTimerId, DataInterval, 0);
// The chart update rate initially set to 250ms
m_UpdatePeriod.SelectString(0, _T("250"));
OnSelchangeUpdatePeriod();
return TRUE;
}
//
// User clicks on the Pointer pushbutton
//
void CRealTimeMultiChartDlg::OnPointerPB()
{
m_ChartViewer.setMouseUsage(Chart::MouseUsageScroll);
}
//
// User clicks on the Zoom In pushbutton
//
void CRealTimeMultiChartDlg::OnZoomInPB()
{
m_ChartViewer.setMouseUsage(Chart::MouseUsageZoomIn);
}
//
// User clicks on the Zoom Out pushbutton
//
void CRealTimeMultiChartDlg::OnZoomOutPB()
{
m_ChartViewer.setMouseUsage(Chart::MouseUsageZoomOut);
}
//
// User clicks on the Save pushbutton
//
void CRealTimeMultiChartDlg::OnSavePB()
{
// Supported formats = PNG, JPG, GIF, BMP, SVG and PDF
TCHAR szFilters[]= _T("PNG (*.png)|*.png|JPG (*.jpg)|*.jpg|GIF (*.gif)|*.gif|")
_T("BMP (*.bmp)|*.bmp|SVG (*.svg)|*.svg|PDF (*.pdf)|*.pdf||");
// The standard CFileDialog
CFileDialog fileDlg(FALSE, _T("png"), _T("chartdirector_demo"), OFN_HIDEREADONLY |
OFN_OVERWRITEPROMPT, szFilters);
if(fileDlg.DoModal() != IDOK)
return;
// Save the chart
CString path = fileDlg.GetPathName();
BaseChart *c = m_ChartViewer.getChart();
if (0 != c)
c->makeChart(TCHARtoUTF8(path));
}
//
// User clicks on the the horizontal scroll bar
//
void CRealTimeMultiChartDlg::OnHScroll(UINT nSBCode, UINT nPos, CScrollBar* pScrollBar)
{
// Update the view port if the scroll bar has moved
double newViewPortLeft = moveScrollBar(nSBCode, nPos, pScrollBar);
if (newViewPortLeft != m_ChartViewer.getViewPortLeft())
{
m_ChartViewer.setViewPortLeft(newViewPortLeft);
m_ChartViewer.updateViewPort(true, false);
}
CDialog::OnHScroll(nSBCode, nPos, pScrollBar);
}
//
// User changes the chart update period
//
void CRealTimeMultiChartDlg::OnSelchangeUpdatePeriod()
{
CString s;
m_UpdatePeriod.GetLBText(m_UpdatePeriod.GetCurSel(), s);
SetTimer(ChartUpdateTimerId, _tcstol(s, 0, 0), 0);
}
//
// Handles timer events
//
void CRealTimeMultiChartDlg::OnTimer(UINT_PTR nIDEvent)
{
switch (nIDEvent)
{
case DataRateTimerId:
// Is data acquisition timer
OnDataRateTimer();
break;
case ChartUpdateTimerId:
// Is chart update timer
OnChartUpdateTimer();
break;
}
CDialog::OnTimer(nIDEvent);
}
//
// View port changed event
//
void CRealTimeMultiChartDlg::OnViewPortChanged()
{
// In addition to updating the chart, we may also need to update other controls that
// changes based on the view port.
updateControls(&m_ChartViewer);
// Update the chart if necessary
if (m_ChartViewer.needUpdateChart())
drawMultiChart(&m_ChartViewer);
}
//
// Draw track cursor when mouse is moving over plotarea
//
void CRealTimeMultiChartDlg::OnMouseMovePlotArea()
{
drawMultiTrackLine((MultiChart*)m_ChartViewer.getChart(), m_ChartViewer.getPlotAreaMouseX());
m_ChartViewer.updateDisplay();
}
//
// The data acquisition routine. In this demo, this is invoked every 250ms.
//
void CRealTimeMultiChartDlg::OnDataRateTimer()
{
// The current time in millisecond resolution
SYSTEMTIME st;
GetLocalTime(&st);
double now = Chart::chartTime(st.wYear, st.wMonth, st.wDay, st.wHour, st.wMinute, st.wSecond)
+ st.wMilliseconds / 1000.0;
//
// Use a loop to generate random numbers since the last time this method is called.
//
do
{
// In this example, we use some formulas to generate new values.
double p = m_nextDataTime * 4;
double dataA = 20 + cos(p * 2.2) * 10 + 1 / (cos(p) * cos(p) + 0.01);
double dataB = 150 + 100 * sin(p / 27.7) * sin(p / 10.1);
double dataC = 150 + 100 * cos(p / 6.7) * cos(p / 11.9);
// If the data arrays are full, we remove the oldest 5% of data.
if (m_currentIndex >= sampleSize)
{
m_currentIndex = sampleSize * 95 / 100 - 1;
for(int i = 0; i < m_currentIndex; ++i)
{
int srcIndex = i + sampleSize - m_currentIndex;
m_timeStamps[i] = m_timeStamps[srcIndex];
m_dataSeriesA[i] = m_dataSeriesA[srcIndex];
m_dataSeriesB[i] = m_dataSeriesB[srcIndex];
m_dataSeriesC[i] = m_dataSeriesC[srcIndex];
}
}
// Store the new values in the current index position, and increment the index.
m_timeStamps[m_currentIndex] = m_nextDataTime;
m_dataSeriesA[m_currentIndex] = dataA;
m_dataSeriesB[m_currentIndex] = dataB;
m_dataSeriesC[m_currentIndex] = dataC;
++m_currentIndex;
m_nextDataTime += DataInterval / 1000.0;
}
while (m_nextDataTime < now);
//
// We provide some visual feedback to the latest numbers generated, so you can see the data
// being generated.
//
char buffer[1024];
sprintf_s(buffer, sizeof(buffer), " %.2f", m_dataSeriesA[m_currentIndex - 1]);
m_ValueA.SetWindowText(CString(buffer));
sprintf_s(buffer, sizeof(buffer), " %.2f", m_dataSeriesB[m_currentIndex - 1]);
m_ValueB.SetWindowText(CString(buffer));
sprintf_s(buffer, sizeof(buffer), " %.2f", m_dataSeriesC[m_currentIndex - 1]);
m_ValueC.SetWindowText(CString(buffer));
}
//
// Update the chart and the viewport periodically
//
void CRealTimeMultiChartDlg::OnChartUpdateTimer()
{
if (m_currentIndex > 0)
{
//
// As we added more data, we may need to update the full range of the viewport.
//
double startDate = m_timeStamps[0];
double endDate = m_timeStamps[m_currentIndex - 1];
// Use the initialFullRange (which is 60 seconds in this demo) if this is sufficient.
double duration = endDate - startDate;
if (duration < initialFullRange)
endDate = startDate + initialFullRange;
// Update the full range to reflect the actual duration of the data. In this case,
// if the view port is viewing the latest data, we will scroll the view port as new
// data are added. If the view port is viewing historical data, we would keep the
// axis scale unchanged to keep the chart stable.
int updateType = Chart::ScrollWithMax;
if (m_ChartViewer.getViewPortLeft() + m_ChartViewer.getViewPortWidth() < 0.999)
updateType = Chart::KeepVisibleRange;
bool scaleHasChanged = m_ChartViewer.updateFullRangeH("x", startDate, endDate, updateType);
// Set the zoom in limit as a ratio to the full range
m_ChartViewer.setZoomInWidthLimit(zoomInLimit / (m_ChartViewer.getValueAtViewPort("x", 1) -
m_ChartViewer.getValueAtViewPort("x", 0)));
// Trigger the viewPortChanged event to update the display if the axis scale has changed
// or if new data are added to the existing axis scale.
if (scaleHasChanged || (duration < initialFullRange))
m_ChartViewer.updateViewPort(true, false);
}
}
//
// Handle scroll bar events
//
double CRealTimeMultiChartDlg::moveScrollBar(UINT nSBCode, UINT nPos, CScrollBar* pScrollBar)
{
//
// Get current scroll bar position
//
SCROLLINFO info;
info.cbSize = sizeof(SCROLLINFO);
info.fMask = SIF_ALL;
pScrollBar->GetScrollInfo(&info);
//
// Compute new position based on the type of scroll bar events
//
int newPos = info.nPos;
switch (nSBCode)
{
case SB_LEFT:
newPos = info.nMin;
break;
case SB_RIGHT:
newPos = info.nMax;
break;
case SB_LINELEFT:
newPos -= (info.nPage > 10) ? info.nPage / 10 : 1;
break;
case SB_LINERIGHT:
newPos += (info.nPage > 10) ? info.nPage / 10 : 1;
break;
case SB_PAGELEFT:
newPos -= info.nPage;
break;
case SB_PAGERIGHT:
newPos += info.nPage;
break;
case SB_THUMBTRACK:
newPos = info.nTrackPos;
break;
}
if (newPos < info.nMin) newPos = info.nMin;
if (newPos > info.nMax) newPos = info.nMax;
// Update the scroll bar with the new position
pScrollBar->SetScrollPos(newPos);
// Returns the position of the scroll bar as a ratio of its total length
return ((double)(newPos - info.nMin)) / (info.nMax - info.nMin);
}
//
// Update controls when the view port changed
//
void CRealTimeMultiChartDlg::updateControls(CChartViewer *viewer)
{
// Update the scroll bar to reflect the view port position and width of the view port.
m_HScrollBar.EnableWindow(viewer->getViewPortWidth() < 1);
if (viewer->getViewPortWidth() < 1)
{
SCROLLINFO info;
info.cbSize = sizeof(SCROLLINFO);
info.fMask = SIF_ALL;
info.nMin = 0;
info.nMax = 0x1fffffff;
info.nPage = (int)ceil(viewer->getViewPortWidth() * (info.nMax - info.nMin));
info.nPos = (int)(0.5 + viewer->getViewPortLeft() * (info.nMax - info.nMin)) + info.nMin;
m_HScrollBar.SetScrollInfo(&info);
}
}
//
// Draw a single chart
//
XYChart* CRealTimeMultiChartDlg::drawXYChart(CChartViewer *viewer, const double* dataSeries,
const char *name, int color, Axis* xAxisScale, bool xAxisVisible)
{
// Get the start date and end date that are visible on the chart.
double viewPortStartDate = viewer->getValueAtViewPort("x", viewer->getViewPortLeft());
double viewPortEndDate = viewer->getValueAtViewPort("x", viewer->getViewPortRight());
// Extract the part of the data arrays that are visible.
DoubleArray viewPortTimeStamps;
DoubleArray viewPortDataSeries;
if (m_currentIndex > 0)
{
// Get the array indexes that corresponds to the visible start and end dates
int startIndex = (int)floor(Chart::bSearch(DoubleArray(m_timeStamps, m_currentIndex), viewPortStartDate));
int endIndex = (int)ceil(Chart::bSearch(DoubleArray(m_timeStamps, m_currentIndex), viewPortEndDate));
int noOfPoints = endIndex - startIndex + 1;
// Extract the visible data
viewPortTimeStamps = DoubleArray(m_timeStamps + startIndex, noOfPoints);
viewPortDataSeries = DoubleArray(dataSeries + startIndex, noOfPoints);
}
//
// At this stage, we have extracted the visible data. We can use those data to plot the chart.
//
//================================================================================
// Configure overall chart appearance.
//================================================================================
// Only the last chart has an x-axis
int extraHeght = xAxisVisible ? xAxisHeight : 0;
// Create an XYChart object of size 640 x 150 pixels (or 180 pixels for the last chart)
XYChart* c = new XYChart(640, chartHeight + extraHeght);
// Set the plotarea at (55, 10) with width 80 pixels less than chart width, and height 20 pixels
// less than chart height. Use a vertical gradient from light blue (f0f6ff) to sky blue (a0c0ff)
// as background. Set border to transparent and grid lines to white (ffffff).
c->setPlotArea(55, 10, c->getWidth() - 85, c->getHeight() - 20 - extraHeght, c->linearGradientColor(0, 10, 0,
c->getHeight() - 20 - extraHeght, 0xf0f6ff, 0xa0c0ff), -1, Chart::Transparent, 0xffffff, 0xffffff);
// As the data can lie outside the plotarea in a zoomed chart, we need enable clipping.
c->setClipping();
// Add a legend box at (55, 5) using horizontal layout. Use 8pts Arial Bold as font. Set the
// background and border color to Transparent and use line style legend key.
LegendBox* b = c->addLegend(55, 5, false, "Arial Bold", 10);
b->setBackground(Chart::Transparent);
b->setLineStyleKey();
// Set the x and y axis stems to transparent and the label font to 10pt Arial
c->xAxis()->setColors(Chart::Transparent);
c->yAxis()->setColors(Chart::Transparent);
c->xAxis()->setLabelStyle("Arial", 10);
c->yAxis()->setLabelStyle("Arial", 10);
// Add axis title using 10pts Arial Bold Italic font
c->yAxis()->setTitle(name, "Arial Bold", 10);
//================================================================================
// Add data to chart
//================================================================================
// Add a line layer with the given data, with a line width of 2 pixels.
LineLayer* layer = c->addLineLayer();
layer->setLineWidth(2);
layer->setXData(viewPortTimeStamps);
layer->addDataSet(viewPortDataSeries, color, name);
//================================================================================
// Configure axis scale and labelling
//================================================================================
// For the automatic axis labels, set the minimum spacing to 30 pixels for the y axis.
c->yAxis()->setTickDensity(30);
if (0 != xAxisScale)
{
// If xAxisScale is given, then use it to synchronize with other charts.
c->xAxis()->copyAxis(xAxisScale);
}
else if (m_currentIndex > 0)
{
// If xAxisScale is null, this is the first chart, and it needs to set up the axis scale.
c->xAxis()->setDateScale(viewPortStartDate, viewPortEndDate);
// For the automatic axis labels, set the minimum spacing to 75 pixels for the x axis.
c->xAxis()->setTickDensity(75);
//
// In this example, the axis range can change from a few seconds to thousands of seconds.
// We can need to define the axis label format for the various cases.
//
// If all ticks are minute algined, then we use "hh:nn" as the label format.
c->xAxis()->setFormatCondition("align", 60);
c->xAxis()->setLabelFormat("{value|hh:nn}");
// If all other cases, we use "hh:nn:ss" as the label format.
c->xAxis()->setFormatCondition("else");
c->xAxis()->setLabelFormat("{value|hh:nn:ss}");
// We make sure the tick increment must be at least 1 second.
c->xAxis()->setMinTickInc(1);
}
// Hide the x-axis if it is not visible.
if (!xAxisVisible)
c->xAxis()->setColors(Chart::Transparent, Chart::Transparent);
//================================================================================
// Output the chart
//================================================================================
return c;
}
//
// Draw the MultiChart
//
void CRealTimeMultiChartDlg::drawMultiChart(CChartViewer* viewer)
{
// The MultiChart contains 3 charts. The x-axis is only visible on the last chart, so we only
// need to reserve space for 1 x-axis.
MultiChart* m = new MultiChart(640, 30 + 3 * chartHeight + xAxisHeight);
m->addTitle("Real-Time MultiChart with Zoom/Scroll and Track Line", "Arial", 16);
// This first chart is responsible for setting up the x-axis scale.
m->addChart(0, 30, drawXYChart(viewer, m_dataSeriesA, "Alpha", 0xff0000, 0, false));
Axis* xAxisScale = ((XYChart*)m->getChart(0))->xAxis();
// All other charts synchronize their x-axes with that of the first chart.
m->addChart(0, 30 + chartHeight, drawXYChart(viewer, m_dataSeriesB, "Beta", 0x00cc00,
xAxisScale, false));
// The last chart displays the x-axis.
m->addChart(0, 30 + chartHeight * 2, drawXYChart(viewer, m_dataSeriesC, "Gamma", 0x0000ff,
xAxisScale, true));
// We need to update the track line too. If the mouse is moving on the chart, the track line
// will be updated in MouseMovePlotArea. Otherwise, we need to update the track line here.
if (!viewer->isInMouseMoveEvent())
drawMultiTrackLine(m, (0 == viewer->getChart()) ? m->getWidth() : viewer->getPlotAreaMouseX());
// Set the combined plot area to be the bounding box of the plot areas of the 3 charts
m->setMainChart(m);
deleteMultiChart((MultiChart*)viewer->getChart());
viewer->setChart(m);
}
//
// Delete the MultiChart and all its subcharts
//
void CRealTimeMultiChartDlg::deleteMultiChart(MultiChart *m)
{
if (0 != m)
{
// Delete all the charts inside the MultiChart, then delete the MultiChart itself.
for (int i = 0; i < m->getChartCount(); ++i)
delete m->getChart(i);
delete m;
}
}
//
// Draw track cursor for MultiChart
//
void CRealTimeMultiChartDlg::drawMultiTrackLine(MultiChart* m, int mouseX)
{
// Obtain the dynamic layer of the MultiChart
DrawArea* d = m->initDynamicLayer();
// Ask each XYChart to draw the track cursor on the dynamic layer
for (int i = 0; i < m->getChartCount(); ++i)
drawXYTrackLine(d, (XYChart*)m->getChart(i), mouseX, i == m->getChartCount() - 1);
}
//
// Draw track line with data labels
//
void CRealTimeMultiChartDlg::drawXYTrackLine(DrawArea* d, XYChart* c, int mouseX, bool hasXAxis)
{
// In a MultiChart, the XYChart is offsetted from the dynamic layer of the MultiChart
int offsetY = c->getAbsOffsetY();
// The plot area object
PlotArea* plotArea = c->getPlotArea();
// Get the data x-value that is nearest to the mouse, and find its pixel coordinate.
double xValue = c->getNearestXValue(mouseX);
int xCoor = c->getXCoor(xValue);
if (xCoor < plotArea->getLeftX())
return;
// Draw a vertical track line at the x-position
d->vline(plotArea->getTopY() + offsetY, plotArea->getBottomY() + offsetY, xCoor, 0x888888);
// Draw a label on the x-axis to show the track line position.
if (hasXAxis)
{
std::ostringstream xlabel;
xlabel << "<*font,bgColor=000000*> " << c->xAxis()->getFormattedLabel(xValue, "hh:nn:ss.ff")
<< " <*/font*>";
TTFText* t = d->text(xlabel.str().c_str(), "Arial Bold", 10);
// Restrict the x-pixel position of the label to make sure it stays inside the chart image.
int xLabelPos = (std::max)(0, (std::min)(xCoor - t->getWidth() / 2, c->getWidth() - t->getWidth()));
t->draw(xLabelPos, plotArea->getBottomY() + 6 + offsetY, 0xffffff);
t->destroy();
}
// Iterate through all layers to draw the data labels
for (int i = 0; i < c->getLayerCount(); ++i)
{
Layer* layer = c->getLayerByZ(i);
// The data array index of the x-value
int xIndex = layer->getXIndexOf(xValue);
// Iterate through all the data sets in the layer
for (int j = 0; j < layer->getDataSetCount(); ++j)
{
DataSet* dataSet = layer->getDataSetByZ(j);
const char* dataSetName = dataSet->getDataName();
// Get the color and position of the data label
int color = dataSet->getDataColor();
int yCoor = c->getYCoor(dataSet->getPosition(xIndex), dataSet->getUseYAxis());
// Draw a track dot with a label next to it for visible data points in the plot area
if ((yCoor >= plotArea->getTopY()) && (yCoor <= plotArea->getBottomY()) && (color !=
Chart::Transparent) && dataSetName && *dataSetName)
{
d->circle(xCoor, yCoor + offsetY, 4, 4, color, color);
std::ostringstream label;
label << "<*font,bgColor=" << std::hex << color << "*> "
<< c->formatValue(dataSet->getValue(xIndex), "{value|P4}") << " <*font*>";
TTFText*t = d->text(label.str().c_str(), "Arial Bold", 10);
// Draw the label on the right side of the dot if the mouse is on the left side the
// chart, and vice versa. This ensures the label will not go outside the chart image.
if (xCoor <= (plotArea->getLeftX() + plotArea->getRightX()) / 2)
t->draw(xCoor + 6, yCoor + offsetY, 0xffffff, Chart::Left);
else
t->draw(xCoor - 6, yCoor + offsetY, 0xffffff, Chart::Right);
t->destroy();
}
}
}
}
/////////////////////////////////////////////////////////////////////////////
// General utilities
//
// Load an icon resource into a button
//
void CRealTimeMultiChartDlg::loadButtonIcon(int buttonId, int iconId, int width, int height)
{
// Resize the icon to match the screen DPI for high DPI support
HDC screen = ::GetDC(0);
double scaleFactor = GetDeviceCaps(screen, LOGPIXELSX) / 96.0;
::ReleaseDC(0, screen);
width = (int)(width * scaleFactor + 0.5);
height = (int)(height * scaleFactor + 0.5);
GetDlgItem(buttonId)->SendMessage(BM_SETIMAGE, IMAGE_ICON, (LPARAM)::LoadImage(
AfxGetResourceHandle(), MAKEINTRESOURCE(iconId), IMAGE_ICON, width, height, LR_DEFAULTCOLOR));
}
© 2023 Advanced Software Engineering Limited. All rights reserved.