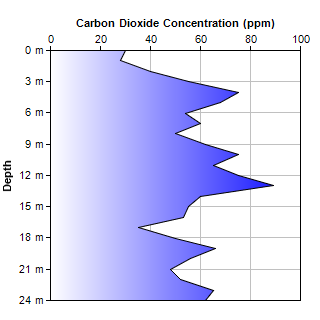
This example demonstrates swapping the x and y axes to produce an rotated area chart in which the area goes from left to right (instead of bottom to top).
The x and y axes in the example are configured as follows:
- Initially, the x-axis is horizontal from left to right at the bottom of the plot area, while the y-axis is vertical from bottom to top at the left side of the plot area.
- Swap the x and y axes using XYChart.swapXY. Now the x-axis is vertical from bottom to top at the left side of the chart, while the y-axis is horizontal from left to right at the bottom of the chart.
- Use XYChart.setYAxisOnRight to move the y-axis to the opposite side of the plot area, so that the y-axis is at the top of the plot area. (Note: the "right" word on setYAxisOnRight means the "right" side before "swapXY" rotation. After rotation, the right side will become to top side.)
- Use Axis.setReverse to reverse the direction of the x-axis, so that the x-axis is vertical from top to bottom (instead of from bottom to top).
The area in this chart is filled using a gradient color created with
BaseChart.gradientColor.
The following is the command line version of the code in "cppdemo/rotatedarea". The MFC version of the code is in "mfcdemo/mfcdemo". The Qt Widgets version of the code is in "qtdemo/qtdemo". The QML/Qt Quick version of the code is in "qmldemo/qmldemo".
#include "chartdir.h"

int main(int argc, char *argv[])
{
    // The data for the area chart
    double data[] = {30, 28, 40, 55, 75, 68, 54, 60, 50, 62, 75, 65, 75, 89, 60, 55, 53, 35, 50, 66,
        56, 48, 52, 65, 62};
    const int data_size = (int)(sizeof(data)/sizeof(*data));

    // The labels for the area chart
    double labels[] = {0, 1, 2, 3, 4, 5, 6, 7, 8, 9, 10, 11, 12, 13, 14, 15, 16, 17, 18, 19, 20, 21,
        22, 23, 24};
    const int labels_size = (int)(sizeof(labels)/sizeof(*labels));

    // Create a XYChart object of size 320 x 320 pixels
    XYChart* c = new XYChart(320, 320);

    // Swap the x and y axis to become a rotated chart
    c->swapXY();

    // Set the y axis on the top side (right + rotated = top)
    c->setYAxisOnRight();

    // Reverse the x axis so it is pointing downwards
    c->xAxis()->setReverse();

    // Set the plotarea at (50, 50) and of size 200 x 200 pixels. Enable horizontal and vertical
    // grids by setting their colors to grey (0xc0c0c0).
    c->setPlotArea(50, 50, 250, 250)->setGridColor(0xc0c0c0, 0xc0c0c0);

    // Add a line chart layer using the given data
    c->addAreaLayer(DoubleArray(data, data_size), c->gradientColor(50, 0, 300, 0, 0xffffff, 0x0000ff
        ));

    // Set the labels on the x axis. Append "m" after the value to show the unit.
    c->xAxis()->setLabels(DoubleArray(labels, labels_size), "{value} m");

    // Display 1 out of 3 labels.
    c->xAxis()->setLabelStep(3);

    // Add a title to the x axis
    c->xAxis()->setTitle("Depth");

    // Add a title to the y axis
    c->yAxis()->setTitle("Carbon Dioxide Concentration (ppm)");

    // Output the chart
    c->makeChart("rotatedarea.png");

    //free up resources
    delete c;

    return 0;
}
© 2023 Advanced Software Engineering Limited. All rights reserved.