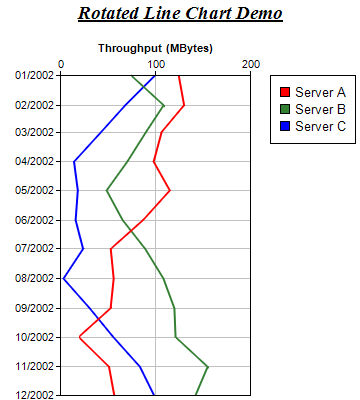
This example demonstrates swapping the x and y axes to produce a rotated line chart in which the line goes from top to bottom (instead of left to right).
The x and y axes in the example are configured as follows:
- Initially, the x-axis is horizontal from left to right at the bottom of the plot area, while the y-axis is vertical from bottom to top at the left side of the plot area.
- Swap the x and y axes using XYChart.swapXY. Now the x-axis is vertical from bottom to top at the left side of the chart, while the y-axis is horizontal from left to right at the bottom of the chart.
- Use XYChart.setYAxisOnRight to move the y-axis to the opposite side of the plot area, so that the y-axis is at the top of the plot area. (Note: the "right" word on setYAxisOnRight means the "right" side before "swapXY" rotation. After rotation, the right side will become to top side.)
- Use Axis.setReverse to reverse the direction of the x-axis, so that the x-axis is vertical from top to bottom (instead of from bottom to top).
For demo purposes, this example uses
RanTable to simulate a database table with 4 columns, in which one is a date/time column and the remaining three are data columns. The date/time column is passed to ChartDirector as the x values using
Layer.setXData, while the data columns are passed to ChartDirector as y values using
Layer.addDataSet.
The following is the command line version of the code in "cppdemo/rotatedline". The MFC version of the code is in "mfcdemo/mfcdemo". The Qt Widgets version of the code is in "qtdemo/qtdemo". The QML/Qt Quick version of the code is in "qmldemo/qmldemo".
#include "chartdir.h"

int main(int argc, char *argv[])
{
    //
    //    We use a random table to simulate generating 12 months of data
    //

    // Create the random table object with 4 cols * 12 rows, using 3 as seed
    RanTable* rantable = new RanTable(3, 4, 12);

    // Set the 1st column to be the 12 months of year 2002
    rantable->setDateCol(0, Chart::chartTime(2002, 1, 1), 86400 * 30);

    // Set the 2nd, 3rd and 4th columns to be random numbers starting from 125, 75, and 100
    // respectively. The change between rows is set to -35 to + 35. The minimum value of any cell is
    // 0.
    rantable->setCol(1, 125, -35, 35, 0);
    rantable->setCol(2, 75, -35, 35, 0);
    rantable->setCol(3, 100, -35, 35, 0);

    // Get the 1st column (time) as the x data
    DoubleArray dataX = rantable->getCol(0);

    // Get the 2nd, 3rd and 4th columns as 3 data sets
    DoubleArray dataY0 = rantable->getCol(1);
    DoubleArray dataY1 = rantable->getCol(2);
    DoubleArray dataY2 = rantable->getCol(3);

    // Create a XYChart object of size 360 x 400 pixels
    XYChart* c = new XYChart(360, 400);

    // Add a title to the chart
    c->addTitle("<*underline=2*>Rotated Line Chart Demo", "Times New Roman Bold Italic", 14);

    // Set the plotarea at (60, 75) and of size 190 x 320 pixels. Turn on both horizontal and
    // vertical grid lines with light grey color (0xc0c0c0)
    c->setPlotArea(60, 75, 190, 320)->setGridColor(0xc0c0c0, 0xc0c0c0);

    // Add a legend box at (270, 75)
    c->addLegend(270, 75);

    // Swap the x and y axis to become a rotated chart
    c->swapXY();

    // Set the y axis on the top side (right + rotated = top)
    c->setYAxisOnRight();

    // Add a title to the y axis
    c->yAxis()->setTitle("Throughput (MBytes)");

    // Reverse the x axis so it is pointing downwards
    c->xAxis()->setReverse();

    // Add a line chart layer using the given data
    LineLayer* layer = c->addLineLayer();
    layer->setXData(dataX);
    layer->addDataSet(dataY0, 0xff0000, "Server A");
    layer->addDataSet(dataY1, 0x338033, "Server B");
    layer->addDataSet(dataY2, 0x0000ff, "Server C");

    // Set the line width to 2 pixels
    layer->setLineWidth(2);

    // Output the chart
    c->makeChart("rotatedline.png");

    //free up resources
    delete rantable;
    delete c;

    return 0;
}
© 2023 Advanced Software Engineering Limited. All rights reserved.