The following is the command line version of the code in "cppdemo/stackedarea". The MFC version of the code is in "mfcdemo/mfcdemo". The Qt Widgets version of the code is in "qtdemo/qtdemo". The QML/Qt Quick version of the code is in "qmldemo/qmldemo".
#include "chartdir.h"
int main(int argc, char *argv[])
{
// The data for the area chart
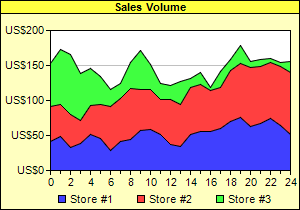
double data0[] = {42, 49, 33, 38, 51, 46, 29, 41, 44, 57, 59, 52, 37, 34, 51, 56, 56, 60, 70,
76, 63, 67, 75, 64, 51};
const int data0_size = (int)(sizeof(data0)/sizeof(*data0));
double data1[] = {50, 45, 47, 34, 42, 49, 63, 62, 73, 59, 56, 50, 64, 60, 67, 67, 58, 59, 73,
77, 84, 82, 80, 84, 89};
const int data1_size = (int)(sizeof(data1)/sizeof(*data1));
double data2[] = {61, 79, 85, 66, 53, 39, 24, 21, 37, 56, 37, 22, 21, 33, 13, 17, 4, 23, 16, 25,
9, 10, 5, 7, 16};
const int data2_size = (int)(sizeof(data2)/sizeof(*data2));
const char* labels[] = {"0", "1", "2", "3", "4", "5", "6", "7", "8", "9", "10", "11", "12",
"13", "14", "15", "16", "17", "18", "19", "20", "21", "22", "23", "24"};
const int labels_size = (int)(sizeof(labels)/sizeof(*labels));
// Create a XYChart object of size 300 x 210 pixels. Set the background to pale yellow
// (0xffffc0) with a black border (0x0)
XYChart* c = new XYChart(300, 210, 0xffffc0, 0x000000);
// Set the plotarea at (50, 30) and of size 240 x 140 pixels. Use white (0xffffff) background.
c->setPlotArea(50, 30, 240, 140)->setBackground(0xffffff);
// Add a legend box at (50, 185) (below of plot area) using horizontal layout. Use 8pt Arial
// font with Transparent background.
c->addLegend(50, 185, false, "", 8)->setBackground(Chart::Transparent);
// Add a title box to the chart using 8pt Arial Bold font, with yellow (0xffff40) background and
// a black border (0x0)
c->addTitle("Sales Volume", "Arial Bold", 8)->setBackground(0xffff40, 0);
// Set the y axis label format to US$nnnn
c->yAxis()->setLabelFormat("US${value}");
// Set the labels on the x axis.
c->xAxis()->setLabels(StringArray(labels, labels_size));
// Display 1 out of 2 labels on the x-axis. Show minor ticks for remaining labels.
c->xAxis()->setLabelStep(2, 1);
// Add an stack area layer with three data sets
AreaLayer* layer = c->addAreaLayer(Chart::Stack);
layer->addDataSet(DoubleArray(data0, data0_size), 0x4040ff, "Store #1");
layer->addDataSet(DoubleArray(data1, data1_size), 0xff4040, "Store #2");
layer->addDataSet(DoubleArray(data2, data2_size), 0x40ff40, "Store #3");
// Output the chart
c->makeChart("stackedarea.png");
//free up resources
delete c;
return 0;
}
© 2023 Advanced Software Engineering Limited. All rights reserved.