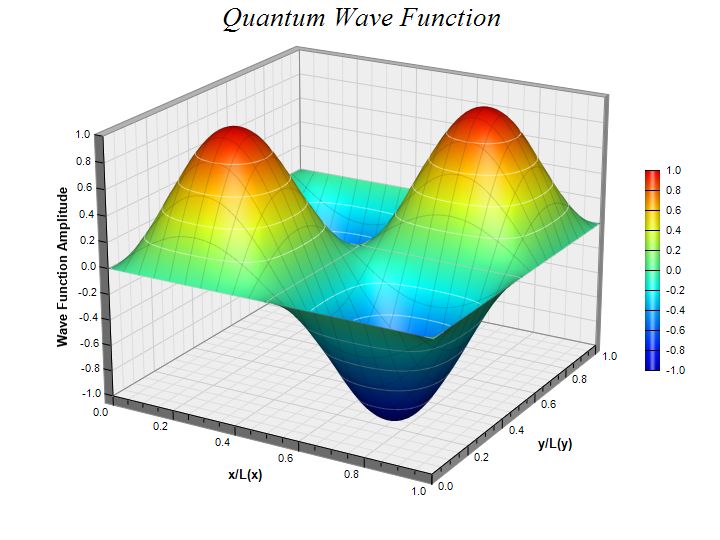
This example extends the
Surface Chart (1) example by adding surface grid and contour lines, and using alternative view angles and continuous coloring.
The following is the command line version of the code in "cppdemo/surface2". The MFC version of the code is in "mfcdemo/mfcdemo". The Qt Widgets version of the code is in "qtdemo/qtdemo". The QML/Qt Quick version of the code is in "qmldemo/qmldemo".
#include "chartdir.h"
#include <math.h>

int main(int argc, char *argv[])
{
    // The x and y coordinates of the grid
    double dataX[] = {0, 0.1, 0.2, 0.3, 0.4, 0.5, 0.6, 0.7, 0.8, 0.9, 1.0};
    const int dataX_size = (int)(sizeof(dataX)/sizeof(*dataX));
    double dataY[] = {0, 0.1, 0.2, 0.3, 0.4, 0.5, 0.6, 0.7, 0.8, 0.9, 1.0};
    const int dataY_size = (int)(sizeof(dataY)/sizeof(*dataY));

    // The values at the grid points. In this example, we will compute the values using the formula
    // z = sin((x - 0.5) * 2 * pi) * sin((y - 0.5) * 2 * pi)
    const int dataZ_size = dataX_size * dataY_size;
    double dataZ[dataZ_size];
    for(int yIndex = 0; yIndex < dataY_size; ++yIndex) {
        double y = (dataY[yIndex] - 0.5) * 2 * 3.1416;
        for(int xIndex = 0; xIndex < dataX_size; ++xIndex) {
            double x = (dataX[xIndex] - 0.5) * 2 * 3.1416;
            dataZ[yIndex * dataX_size + xIndex] = sin(x) * sin(y);
        }
    }

    // Create a SurfaceChart object of size 720 x 540 pixels
    SurfaceChart* c = new SurfaceChart(720, 540);

    // Add a title to the chart using 20 points Times New Roman Italic font
    c->addTitle("Quantum Wave Function", "Times New Roman Italic", 20);

    // Set the center of the plot region at (360, 245), and set width x depth x height to 360 x 360
    // x 270 pixels
    c->setPlotRegion(360, 245, 360, 360, 270);

    // Set the elevation and rotation angles to 20 and 30 degrees
    c->setViewAngle(20, 30);

    // Set the data to use to plot the chart
    c->setData(DoubleArray(dataX, dataX_size), DoubleArray(dataY, dataY_size), DoubleArray(dataZ,
        dataZ_size));

    // Spline interpolate data to a 80 x 80 grid for a smooth surface
    c->setInterpolation(80, 80);

    // Set surface grid lines to semi-transparent black (dd000000)
    c->setSurfaceAxisGrid(0xdd000000);

    // Set contour lines to semi-transparent white (80ffffff)
    c->setContourColor(0x80ffffff);

    // Add a color axis (the legend) in which the left center is anchored at (645, 270). Set the
    // length to 200 pixels and the labels on the right side. Use smooth gradient coloring.
    c->setColorAxis(645, 270, Chart::Left, 200, Chart::Right)->setColorGradient();

    // Set the x, y and z axis titles using 10 points Arial Bold font
    c->xAxis()->setTitle("x/L(x)", "Arial Bold", 10);
    c->yAxis()->setTitle("y/L(y)", "Arial Bold", 10);
    c->zAxis()->setTitle("Wave Function Amplitude", "Arial Bold", 10);

    // Output the chart
    c->makeChart("surface2.jpg");

    //free up resources
    delete c;

    return 0;
}
© 2023 Advanced Software Engineering Limited. All rights reserved.